
Ask most small business owners how much they owe right now, and they can give you a rough number. Ask them how much of that is 60 days overdue, and to which vendors, and the answer is usually a shrug. An accounts payable aging report is what closes that gap — it takes every unpaid vendor invoice and sorts it by how overdue it is, so “we owe some money” turns into “we owe Meridian Freight $4,320 that’s been sitting for 38 days.”
The free accounts payable aging report template below builds that view automatically. Enter your open invoices — vendor, invoice date, due date, amount — and it buckets each one into Current, 1-30, 31-60, 61-90, or 90+ days past due, totals everything by bucket and by vendor, and charts it so the pattern is obvious at a glance instead of buried in a spreadsheet of dates.
What’s Inside the Free Accounts Payable Aging Report Template
The download is a single Excel file with two tabs. The first is the AP Aging Report itself: a report date you control, an open invoice table where you list each vendor invoice, and an aging summary above it that totals what’s owed in each bucket automatically, with a bar chart and a flagged “% past due” figure. The second tab is a Vendor Summary that rolls the same invoices up by vendor — total payable, number of open invoices, and the age of each vendor’s oldest invoice — so you can see immediately which vendor relationship needs a phone call, not just which invoice.
Understanding the Accounts Payable Aging Report
What It Actually Shows
An accounts payable aging report is a snapshot of everything your business currently owes to vendors and suppliers, organized by how long each invoice has been outstanding rather than by vendor or by date alone. It answers three questions at once: how much do we owe in total, how much of that is overdue rather than merely due, and is the overdue portion concentrated in one or two vendors or spread across many. None of those three questions is answerable from a bank balance or a single accounts payable total — you need the age of each invoice to get there.
AP Aging vs. AR Aging — Don’t Mix Them Up
Accounts payable aging and accounts receivable aging sound like the same report with the words swapped, and the mechanics are identical, but they answer opposite questions. An accounts receivable aging report ages the invoices you sent to customers — it tells you who owes you money and how late they are paying it. An accounts payable aging report, the one this template builds, ages the invoices vendors sent you — it tells you who you owe and how late you are paying them. Mixing the two up in conversation with a lender or an accountant is a common enough mistake that it’s worth stating plainly once: payable is what you owe, receivable is what you’re owed.
How an Accounts Payable Aging Report Comes Together
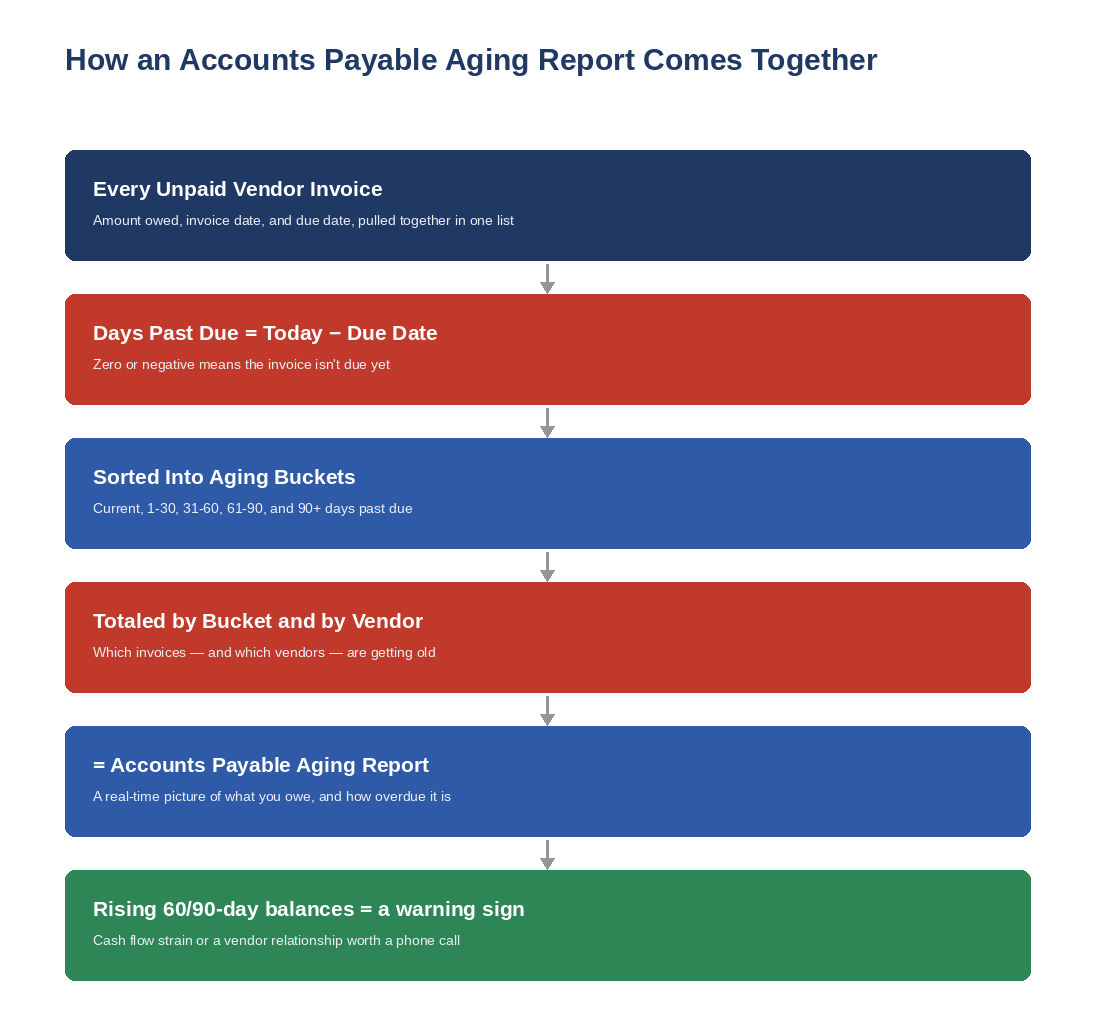
Days Past Due
For every open invoice, days past due is simply today’s date minus the invoice’s due date — not its invoice date. An invoice with 30-day terms issued three weeks ago isn’t past due at all yet; it’s still Current. Days past due only starts counting once the due date itself has passed, and an invoice due tomorrow is treated the same as one due today: zero days past due, not negative.
Aging Buckets
Once every invoice has a days-past-due figure, it gets sorted into a bucket: Current (not yet due), 1-30 days past due, 31-60, 61-90, and 90+. These five buckets are the standard used across accounting software and lender reporting, which is exactly why the template uses them rather than a custom scheme — the numbers will match what your accountant or a bank expects to see.
Vendor Totals
The bucket totals tell you the shape of the problem; the vendor totals tell you where it lives. Two businesses can both show 20% of payables in the 61-90 day bucket, but one has that spread thinly across fifteen vendors while the other owes it all to a single supplier who’s about to stop shipping. The Vendor Summary tab exists specifically to catch the second case before the vendor calls you first.
How to Read Your Aging Buckets
A healthy accounts payable aging report is front-loaded — most of the dollar total sits in Current and 1-30 days, with the balance thinning out fast in the older buckets. That pattern means you’re paying close to on time and only running normal, short administrative delays. When the shape inverts — when 31-60, 61-90, or 90+ start holding meaningful dollars — it’s worth treating as a signal rather than a coincidence, for one of three reasons: cash is genuinely tight and bills are being deliberately stretched, invoices are getting lost or disputed before anyone approves them for payment, or the business has simply outgrown an informal “pay when we remember” process.
As a rough benchmark, most well-run small businesses keep well under 10% of total payables in the 31+ day buckets combined. That’s not a hard rule — a business that intentionally negotiates 60-day terms with a supplier will show older-looking balances that are actually current relative to those terms — but if the percentage is climbing month over month with no such explanation, it’s an earlier and more specific warning than “the bank balance feels low.”
Common Accounts Payable Aging Mistakes
Aging from the invoice date instead of the due date. This is the single most common error and it makes every business look later than it actually is. Terms exist precisely so that an invoice isn’t overdue the moment it arrives.
Running the report and not acting on the 90+ bucket. An invoice that’s 90 days past due is well past the point where it’s a scheduling accident. It usually needs a direct conversation with the vendor — about a payment plan, a dispute, or simply reordering priorities — not another cycle of being carried forward.
Only looking at the total, not the vendor breakdown. A stable-looking total can hide one vendor relationship quietly deteriorating while everything else is paid on time. The Vendor Summary tab is there so this doesn’t require cross-referencing two reports by hand.
Letting the report go stale. An aging report is only accurate as of the date it’s run. Checking it once a quarter means three months of drift before a growing problem becomes visible — by which point a vendor may have already changed your payment terms unilaterally in response.
Confusing “unpaid” with “in dispute.” An invoice held back because of a billing error or a quality issue isn’t the same kind of past-due as one simply waiting in a payment queue. Both belong in the report, but lumping them together in the same bucket without a note can make a resolved-but-unpaid dispute look like a cash problem it isn’t.
How to Use It
Set the Report Date cell to today (or to whatever date you’re reporting as of), then list every open vendor invoice in the table below it — vendor name, invoice number, invoice date, due date, and amount. The Bucket and Days Past Due columns calculate themselves for every row you add. The Aging Summary and the chart at the top update automatically, and the Vendor Summary tab rolls the same data up by vendor with no extra entry required. If you’re pulling this together for the first time, your accounting software’s open-invoice or unpaid-bills report is the fastest source — export it and drop the columns into the template rather than retyping each invoice by hand.
It’s worth running this alongside a Cash Flow Forecast rather than in isolation — the aging report tells you what you owe and how overdue it is, and the forecast tells you whether the cash to cover it is actually going to be there when you plan to pay it.
Frequently Asked Questions
What is an accounts payable aging report?
It’s a report that lists every unpaid vendor invoice and groups it by how long it’s been outstanding — typically Current, 1-30, 31-60, 61-90, and 90+ days past due. It shows total payables, how much of that is overdue, and which vendors it’s owed to, all in one view.
What’s a healthy percentage of payables in the 90+ day bucket?
Close to zero, as a general rule. Most well-run small businesses keep combined 31+ day balances under roughly 10% of total payables. A meaningful, growing 90+ day balance is one of the more specific early signs of a cash flow problem, separate from intentional long payment terms negotiated with a specific vendor. The U.S. Small Business Administration’s guide to managing business finances covers this same early-warning-sign approach as part of overall cash flow health.
How is an AP aging report different from an AR aging report?
An accounts payable (AP) aging report ages what you owe to vendors. An accounts receivable (AR) aging report ages what customers owe you. The bucket structure is identical; the direction of the money is opposite.
Can I build an AP aging report if I use QuickBooks or another accounting system?
Yes — most accounting software can already generate a version of this report natively. This template is useful even if you have that option: it’s easy to customize, easy to hand to someone outside your accounting system (a lender, a partner, an advisor), and doesn’t require software access to check.
How often should I run an AP aging report?
Monthly at minimum, and weekly if your payables are large relative to your cash balance or if you’ve noticed the older buckets creeping up. Checking it only at year-end or when a vendor calls means finding out about a problem after it’s already affected a relationship.
Download the Free Accounts Payable Aging Report Template
Download the free Accounts Payable Aging Report template below — no email signup required. It’s pre-loaded with sample vendor invoices so you can see exactly how the buckets, totals, and chart work before you clear them out and enter your own.
Want new templates emailed to you?
No spam. Unsubscribe anytime. Downloads never require this.
Looking for more small business finance tools? Check out our Cash Flow Forecast Template, Working Capital Calculator, Balance Sheet Template, and our Financial Model Template.
