
A profit and loss statement tells you whether you made money last month. A balance sheet tells you something different and, in a lot of ways, more important: what your business actually owns, what it owes, and what’s genuinely yours after every debt is settled. It’s the one financial statement that shows your business’s financial position at a single point in time rather than its performance over a period — and it’s the statement most owners never learn to read.
The free balance sheet template below fills in automatically as you enter your numbers. List your assets, list your liabilities, and it calculates your total equity, checks that everything balances, and works out four key financial ratios that tell you whether your business is actually in good shape or just looks that way on paper.
What’s Inside the Free Balance Sheet Template
The download is a single Excel file, pre-loaded with sample numbers so you can see how it behaves before entering your own. Enter your current and fixed assets, your current and long-term liabilities, and your owner’s equity accounts, and it totals each section automatically. A built-in balance check confirms your assets equal your liabilities plus equity — the way a balance sheet always should — and flags it clearly if something doesn’t add up. Below that, it calculates your current ratio, quick ratio, debt-to-equity ratio, and working capital, so the numbers translate into an actual read on your financial health.
How to Build a Balance Sheet, Step by Step
The balance sheet has a reputation for being intimidating, mostly because of the accounting vocabulary. The actual structure is simple, and it always follows the same equation.
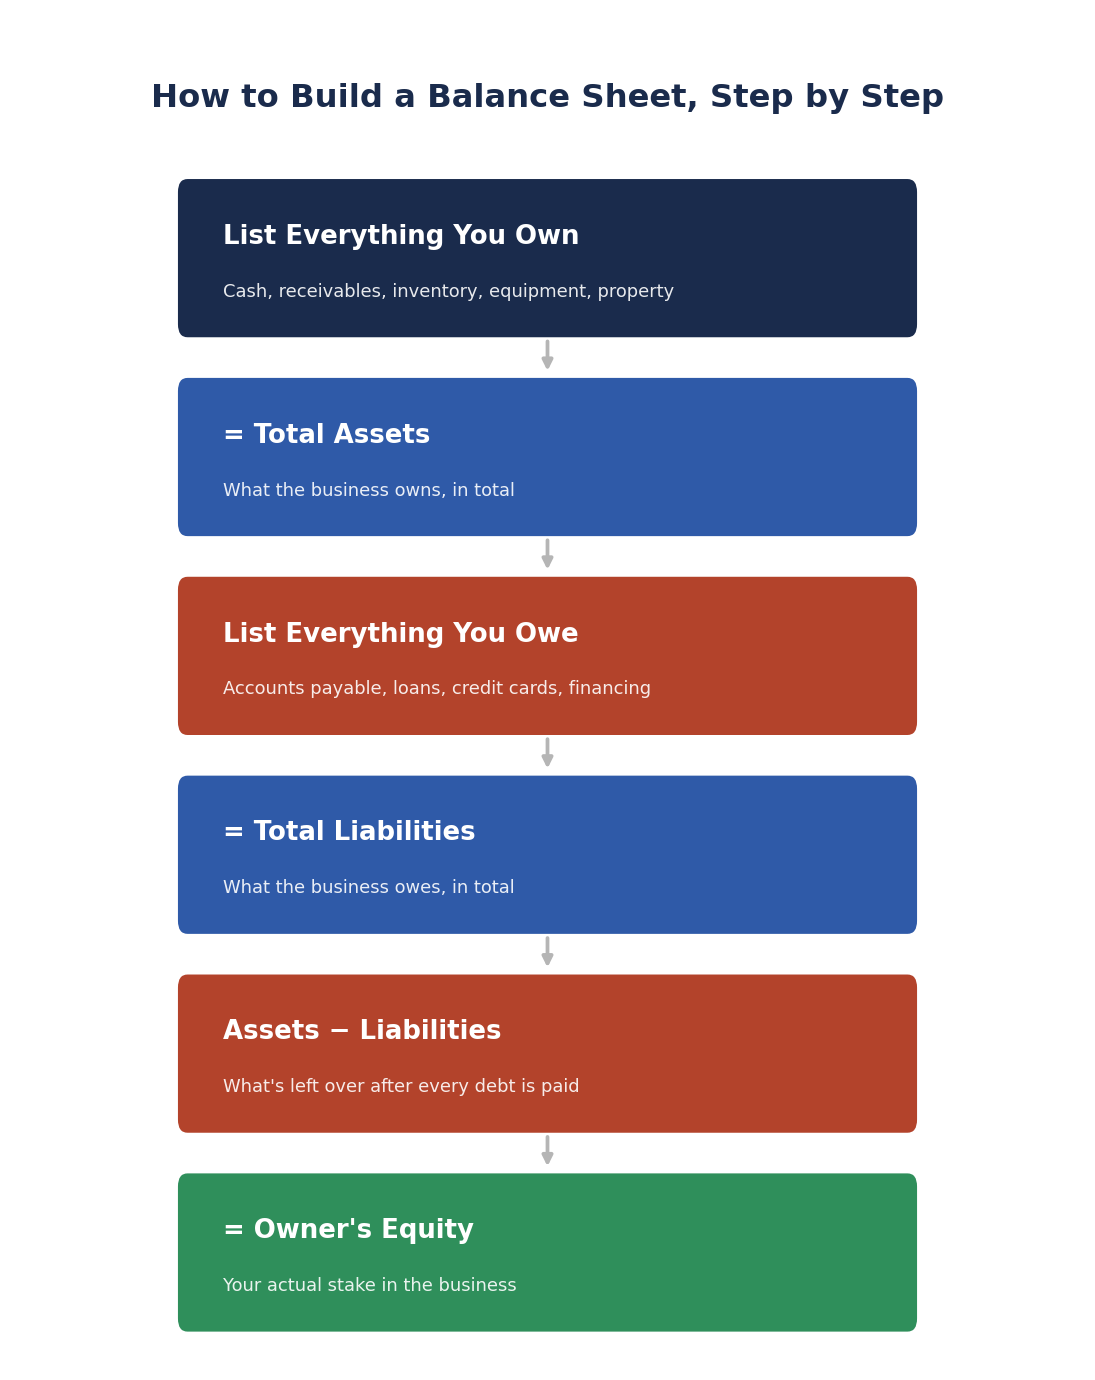
List Everything You Own
Start with your assets — everything of value the business controls. That splits into current assets, which convert to cash within a year (cash itself, accounts receivable, inventory, prepaid expenses), and fixed assets, which are longer-term (equipment, vehicles, property, minus accumulated depreciation).
Total Assets
Add your current and fixed assets together and you get total assets — a single number representing everything the business owns, at the value it’s carried on your books.
List Everything You Owe
Next, your liabilities — every obligation the business has to pay. Current liabilities are due within a year (accounts payable, short-term loans, accrued expenses, credit card balances). Long-term liabilities extend beyond that (long-term loans, notes payable, equipment financing).
Total Liabilities
Add your current and long-term liabilities together and you get total liabilities — everything the business owes, regardless of when it’s due.
Assets − Liabilities
Subtract what you owe from what you own, and what’s left over is the value that actually belongs to the business’s owner rather than to a lender or supplier.
Owner’s Equity
That remainder is your owner’s equity — your capital contributions plus retained earnings from prior years plus current-year net income. It’s the accounting definition of “what the business is worth to you,” and it’s why the balance sheet always balances: assets always equal liabilities plus equity, by definition, not by coincidence.
The Balance Sheet vs. the P&L and Cash Flow Statement
These three statements are usually taught together because each answers a question the others can’t. Your profit and loss statement shows performance — revenue and expenses over a period, ending in a profit or loss. Your cash flow forecast shows movement — cash coming in and going out, month by month. The balance sheet shows position — what the business owns and owes at one specific moment, regardless of how it got there.
A business can be profitable on its P&L, healthy on its cash flow forecast, and still be carrying more debt than its assets can comfortably support — and the balance sheet is the only one of the three that would show you that. None of the three statements is complete on its own; together, they’re the standard set every lender, investor, and accountant expects to see.
What Your Balance Sheet Ratios Actually Tell You
Raw totals only tell you so much — a business with $500,000 in assets could be in excellent shape or in real trouble depending on what it owes. The four ratios calculated in the template turn the raw numbers into an actual read on financial health.
The current ratio (current assets ÷ current liabilities) measures whether you can cover what’s due within a year using what converts to cash within a year. Above 1.5–2.0 is generally considered healthy for a small business; below 1.0 means current liabilities exceed current assets, which is worth investigating.
Quick ratio strips inventory out of current assets before dividing, since inventory can be slow or difficult to convert to cash. It’s a stricter, more conservative version of the current ratio.
Debt-to-equity ratio (total liabilities ÷ total equity) shows how much of the business is financed by debt versus by the owner’s own capital. A high ratio isn’t automatically bad — it depends heavily on the industry — but a rising trend over time is worth watching.
Working capital (current assets − current liabilities) is the dollar-value version of the current ratio, and it’s the number most lenders look at first when evaluating whether a business can meet its short-term obligations.
Common Balance Sheet Mistakes Small Business Owners Make
A handful of errors show up constantly, and most of them come from treating the balance sheet as an afterthought rather than something to check regularly.
Not updating it regularly. A balance sheet is a snapshot — one taken six months ago tells you almost nothing about today. Most accounting software can generate a current one instantly; the mistake is not looking at it.
Forgetting depreciation. Equipment and vehicles lose value over time, and carrying them at their original purchase price overstates your assets. Accumulated depreciation exists specifically to correct for this.
Mixing personal and business assets or liabilities. A personal vehicle or a personal credit card balance doesn’t belong on the business’s balance sheet, and including it distorts every ratio calculated from it.
Ignoring the balance check. If assets don’t equal liabilities plus equity, something is missing, misclassified, or entered twice — it’s not a rounding issue to shrug off, it’s a sign the underlying bookkeeping needs a second look.
Only looking at total assets. A business with a lot of assets tied up in aging inventory or slow-paying receivables can look strong on paper while struggling to cover this month’s bills — which is exactly why the ratios matter as much as the totals.
How to Use It
Start by gathering your actual numbers from your bank statements, accounting software, and loan documents rather than estimating, then open the balance sheet template and enter your current assets, fixed assets, current liabilities, and long-term liabilities into the yellow input cells, then fill in your equity accounts. Check the balance check section first — if it says “Out of Balance,” something needs to be corrected before the ratios below it mean anything.
Once it balances, look at the four ratios together rather than in isolation. A strong current ratio alongside a high debt-to-equity ratio tells a different story than strong numbers across the board — the combination is what actually describes the shape your business is in.
Frequently Asked Questions
What’s the difference between a balance sheet and a P&L?
A P&L shows performance over a period of time — revenue minus expenses, ending in a profit or loss for that month, quarter, or year. A balance sheet shows financial position at a single point in time — what the business owns and owes as of that date. You need both to get a complete financial picture.
Why does a balance sheet have to balance?
Because of the fundamental accounting equation: assets always equal liabilities plus equity. Every dollar of value the business owns was financed either by debt (a liability) or by the owner’s own capital and retained profits (equity) — there’s no third option, so the two sides always reconcile by definition.
What’s a good current ratio for a small business?
The balance sheet template calculates this for you automatically, but as a benchmark, most small businesses aim for a current ratio between 1.5 and 2.0, meaning current assets comfortably exceed current liabilities. Below 1.0 signals the business may struggle to cover short-term obligations without borrowing or delaying payments; well above 2.0 to 3.0 can sometimes mean cash is sitting idle rather than being reinvested.
How does the balance sheet relate to what my business is worth?
It’s the starting point for the asset side of a valuation. Our business valuation calculator uses your total assets minus liabilities as the asset-based floor value — a sanity check against your SDE-multiple valuation. A stronger balance sheet directly supports a stronger asset-based floor.
Do I need an accountant to prepare one?
Not necessarily, for a small, straightforward business — this template handles the calculation once you have accurate numbers. Where it gets more valuable to bring in help is making sure those underlying numbers (asset valuations, depreciation schedules, loan balances) are actually correct. Our guide on bookkeeper vs. accountant vs. CFO breaks down which role handles what.
Download the Free Balance Sheet Template
Download the free Balance Sheet Template below — no email signup required. It’s pre-loaded with sample numbers so you can see exactly how it works before you clear it out and enter your own.
Want new templates emailed to you?
No spam. Unsubscribe anytime. Downloads never require this.
Looking for more small business finance tools? Check out our Profit and Loss Statement Template, our Cash Flow Forecast Template, our Break-Even Calculator, and our Contribution Margin Calculator.
Looking for a dynamic, forward-looking version of this? Our Financial Model Template links your balance sheet to a 12-month income statement and cash flow forecast automatically.
