
“Am I making money?” is the wrong first question for a lot of small businesses — the right one is “how much do I need to sell before I even start?” That number is your break-even point, and most owners either never calculate it or calculate it once and forget it as costs and prices drift. A break-even calculator answers the question directly: exactly how many units, or how much revenue, it takes each month before a single dollar counts as profit.
The math behind break-even is simple — it’s really just fixed costs divided by the profit each sale contributes — but getting a useful answer means separating your costs correctly first, which is where most people get stuck. The free break-even calculator below does the separation and the math for you: enter your price, variable cost, and fixed costs, and it calculates your break-even point in both units and dollars, plus a target-profit version and a chart showing exactly where revenue crosses cost.
What’s Inside the Free Break-Even Calculator
The download is a single Excel file, pre-loaded with sample numbers so you can see how it behaves before entering your own. It covers single-product break-even, a margin-of-safety check, target-profit analysis (how many units to hit a specific profit goal), a weighted-average version for businesses selling more than one product, and a scenario table that feeds a built-in chart showing your revenue and cost lines crossing at the break-even point.
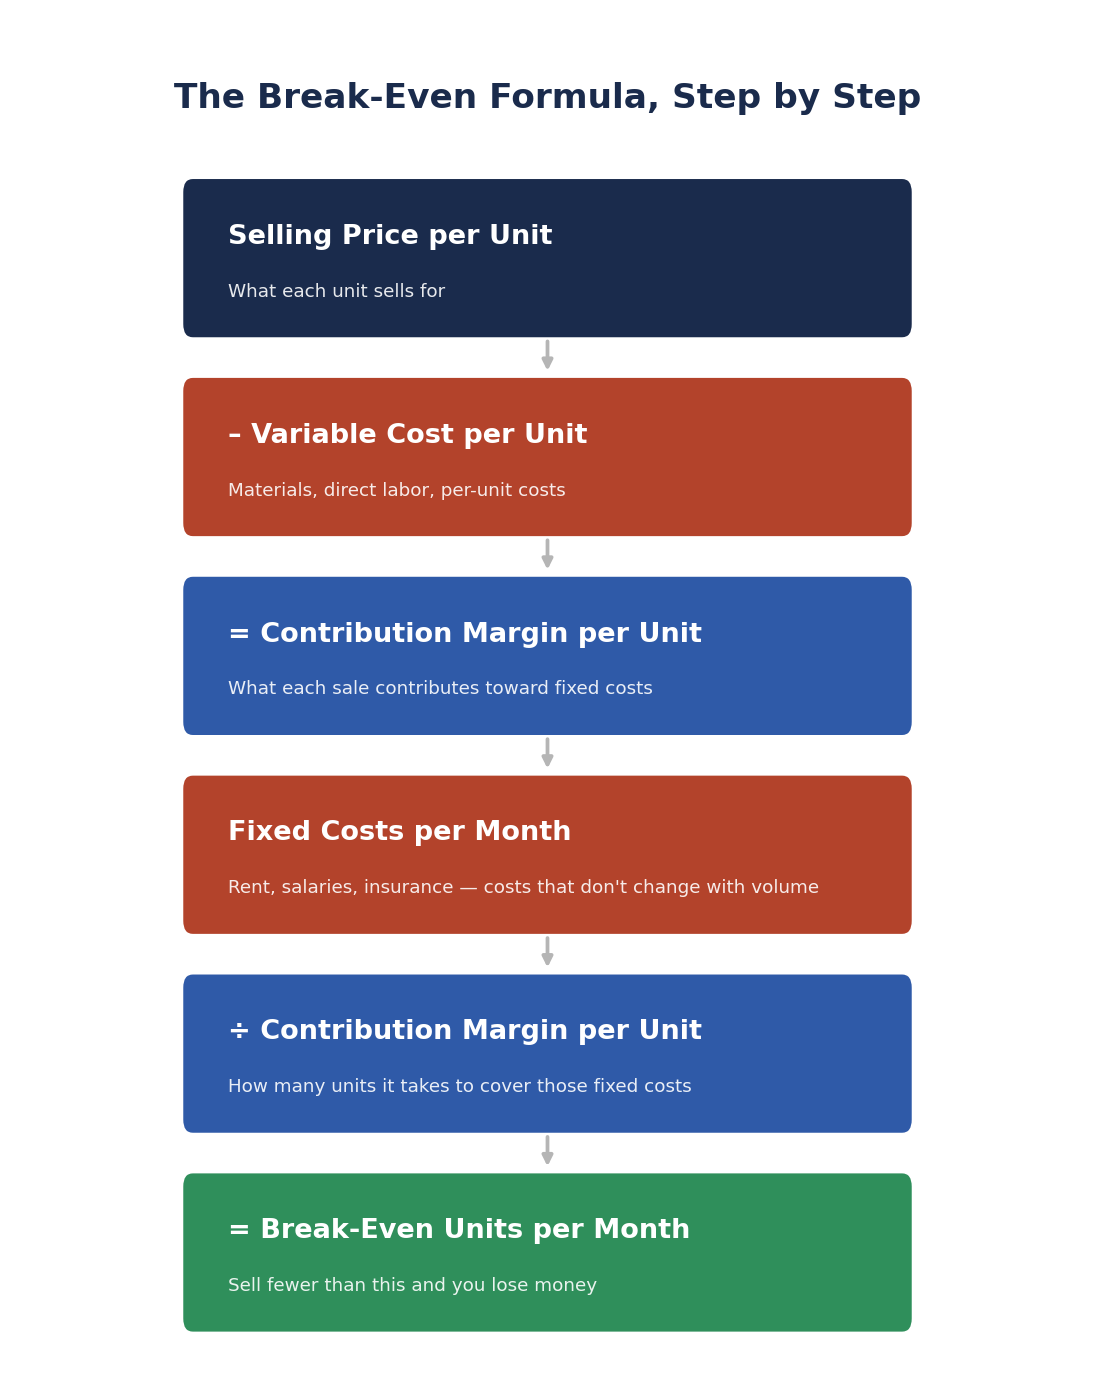
The Break-Even Formula, Step by Step
Break-even sounds abstract until you see it as a sequence of small, ordinary questions.
Selling Price per Unit
What each unit actually sells for, after any typical discount — not your list price if you rarely charge full price.
Variable Cost per Unit
The cost that shows up only when you make or deliver one more unit: materials, direct labor, packaging, a payment processing fee. If the cost disappears when you stop selling, it’s variable.
Contribution Margin per Unit
Selling price minus variable cost per unit. This is the part of every sale that’s actually available to pay down fixed costs and, eventually, become profit. A business that doesn’t know this number is guessing at pricing.
Fixed Costs per Month
Rent, salaries, insurance, loan payments — the costs that show up whether you sell one unit or one thousand. These don’t change with volume in the short term, which is exactly why they need to be covered by contribution margin, not by hope.
Break-Even Units per Month
Fixed costs divided by contribution margin per unit. This is the number of units you need to sell each month just to cover fixed costs — not a single dollar of profit yet, just to stop losing money.
Break-Even Revenue per Month
Break-even units multiplied by selling price. This is often the more useful number to track day to day, since most owners think in monthly revenue targets, not unit counts.
Break-Even in Units vs. Break-Even in Dollars
Both describe the same point, but they’re useful in different situations. Break-even in units is the better number when you sell a single product or a small number of similar items — it’s concrete and easy to track against daily or weekly sales. Break-even in dollars is more useful once you sell multiple products at different prices, since a single “units” figure stops meaning much when a “unit” could be a $12 item or a $1,200 item.
For a business with a genuinely mixed product line, neither single-product number is quite right, which is why the calculator also includes a weighted-average version — it blends your product mix into one effective contribution margin so the break-even figure still means something.
Break-Even Analysis vs. a Full P&L
A break-even calculation and a profit and loss statement answer related but different questions. Break-even analysis asks one question in isolation: at what point does revenue exactly cover costs? It’s a planning tool — useful before you set a price, sign a lease, or decide whether a new product line is worth launching, because it works from assumptions rather than actual historical results.
A profit and loss statement looks backward instead of forward: it reports what actually happened across every category of revenue and expense in a given month, whether or not you’re above or below break-even. In practice the two work together — break-even tells you the target, and your P&L tells you whether you’re hitting it.
Common Break-Even Mistakes Small Business Owners Make
A handful of errors show up constantly, and they all lead to the same problem: a break-even number that looks precise but isn’t actually true.
Mixing variable and fixed costs together. Rent doesn’t belong in variable cost per unit, and packaging materials don’t belong in fixed costs. Getting this split wrong is the single most common reason a break-even calculation comes out wrong, because it directly corrupts the contribution margin number everything else depends on.
Using list price instead of actual average price. If you routinely discount, run promotions, or negotiate, your real average selling price is lower than your list price — and using list price will understate your break-even point, making the business look safer than it is.
Forgetting owner’s compensation. If you’re not paying yourself a market-rate salary and that cost isn’t in your fixed costs, your break-even point is artificially low. It looks like the business covers its costs when it’s actually just not paying you properly.
Calculating it once and never again. Prices change, rent goes up, a new hire adds to fixed costs — a break-even number from eighteen months ago can be meaningfully wrong today. It’s worth recalculating whenever a major cost or price changes, not just once at launch.
Ignoring margin of safety. Knowing your break-even point without also tracking how far current sales are above it means you won’t see a slide toward trouble until you’re already there. The margin-of-safety section in the calculator exists specifically to catch this early.
How to Use It
Start with the single-product section if you sell one thing or a small number of similar items at similar prices — enter your price, variable cost, and monthly fixed costs, and this break-even calculator turns those three numbers into your break-even units and revenue immediately. If you have a current or expected sales number, add it to the margin-of-safety section to see how much cushion you actually have.
If you’re planning toward a specific profit goal rather than just breaking even, use the target-profit section — it answers “how many units do I need to sell to make $5,000 this month,” not just “how many to avoid a loss.” And if your business sells more than one product at meaningfully different margins, use the weighted-average section instead of trying to force everything into a single-product number that won’t be accurate.
Frequently Asked Questions
What’s a good break-even point for a small business?
There’s no universal target — it depends entirely on your fixed costs and margins. The more useful question isn’t whether your break-even number is “good” in the abstract, but how far your actual or expected sales sit above it. A business selling well above its break-even point every month has real cushion; one hovering right at break-even is one bad month away from a loss.
Does break-even analysis include taxes?
Not in the basic version most small businesses use, including this calculator — it works with pre-tax operating numbers. Taxes are usually layered on afterward as part of full profit planning rather than baked into the break-even formula itself.
How is break-even different from profit margin?
Break-even tells you the point where profit is exactly zero. Profit margin tells you how much profit you’re making relative to revenue once you’re past that point. They’re related calculations that use some of the same inputs, but they answer different questions — one is a threshold, the other is a ratio.
Can I use this for a new business that has no sales history yet?
Yes — this is actually one of the most valuable uses of a break-even calculator. Before you sign a lease, set a price, or commit to a big fixed cost, running the numbers on projected price and estimated variable cost tells you how much volume you’d need before the idea even breaks even, which is essential information before you commit any real money.
My contribution margin is negative. What does that mean?
It means you’re losing money on every single unit sold before fixed costs are even considered — more volume would make the problem worse, not better. This almost always means the price is too low, the variable cost is too high, or both, and it needs to be fixed before break-even is even a meaningful question to ask.
Download the Free Break-Even Calculator
Download the free Break-Even Calculator below — no email signup required. It’s pre-loaded with sample numbers so you can see exactly how it works before you clear it out and enter your own.
Want new templates emailed to you?
No spam. Unsubscribe anytime. Downloads never require this.
Looking for more small business finance tools? Check out our Profit and Loss Statement Template, Contribution Margin Calculator, Cash Flow Forecast Template, the Small Business KPI Dashboard, and our Small Business Valuation Calculator.
