
If a bank, a supplier, or an investor looked at your balance sheet tomorrow, would they see enough short-term cushion to feel comfortable? This current ratio calculator answers that question with a single number: how many dollars of current assets you have for every dollar of current liabilities due within a year. It’s the most widely used liquidity ratio in small business finance, and it takes less than two minutes to calculate once you have your numbers in front of you.
What Is Current Ratio?
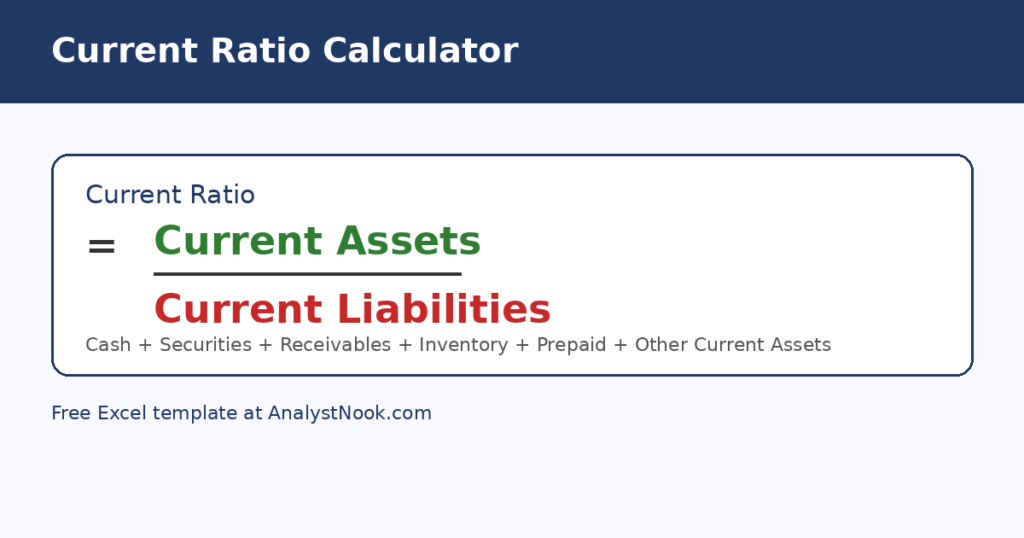
Current Ratio (also called the Working Capital Ratio) measures whether a business can cover its current liabilities — the bills, short-term debt, and other obligations due within the next 12 months — using everything it classifies as a current asset: cash, marketable securities, accounts receivable (AR), inventory, prepaid expenses, and any other asset expected to convert to cash within a year.
It’s the broadest of the common liquidity ratios because it counts every current asset, inventory included. That makes it a good first-pass liquidity check, though it’s worth pairing with the stricter Quick Ratio, which excludes inventory, if a meaningful share of your current assets sits on shelves rather than in the bank.
The Current Ratio Formula
Current Ratio equals Total Current Assets, divided by Total Current Liabilities. Both figures come straight off your balance sheet — there’s no adjustment or exclusion involved, which is what makes this ratio quick to calculate and easy to track over time.
How to Calculate Current Ratio Step by Step
- Add up every current asset: Cash and Cash Equivalents, Marketable Securities, Accounts Receivable, Inventory, Prepaid Expenses, and any other current assets.
- Add up every current liability: Accounts Payable, the current portion of any long-term debt, Accrued Expenses, Unearned Revenue, and any other current liabilities.
- Divide Total Current Assets by Total Current Liabilities.
- Compare the result to the benchmark guide below, and if inventory is a large share of your current assets, calculate your Quick Ratio alongside it for a fuller picture.
A Worked Example
With $18,500 in cash, $4,000 in marketable securities, $26,500 in accounts receivable, $31,000 in inventory, $2,200 in prepaid expenses, and $1,300 in other current assets, Total Current Assets come to $83,500. Against $14,200 in accounts payable, $6,000 in short-term debt, $3,800 in accrued expenses, $2,500 in unearned revenue, and $1,500 in other current liabilities, Total Current Liabilities come to $28,000.
Current Ratio = $83,500 ÷ $28,000 = 2.98x. That’s a healthy cushion — almost three dollars of current assets for every dollar owed in the next year. Stripping out the $31,000 of inventory drops the Quick Ratio to 1.88x, still comfortable, which tells us this business isn’t overly dependent on selling inventory to stay liquid.
Common Mistakes to Avoid
- Mixing in long-term items. Only the portion of debt due within 12 months belongs in current liabilities — the rest stays on the long-term side of the balance sheet.
- Treating a high ratio as automatically good. A current ratio above 4 or 5x can mean too much cash or inventory is sitting idle instead of being reinvested in the business.
- Ignoring what’s inside the number. Two businesses can share the same current ratio with very different risk — one backed mostly by cash, the other mostly by slow-moving inventory. Check your Quick Ratio when that distinction matters.
- Using stale numbers. Current ratio can shift fast with seasonal inventory builds or a slow collection month — recalculate at least monthly if your cash position is tight.
- Comparing across industries. A healthy current ratio for a software company looks nothing like a healthy one for a retailer carrying heavy inventory. Compare against your own trend and your own industry, not a universal number.
How to Use the Excel Template
- Enter each current asset — Cash, Marketable Securities, Accounts Receivable, Inventory, Prepaid Expenses, and Other Current Assets — in the yellow cells.
- Enter each current liability — Accounts Payable, Short-Term Debt, Accrued Expenses, Unearned Revenue, and Other Current Liabilities — in the yellow cells.
- Read your Current Ratio, Working Capital in dollars, and a Quick Ratio comparison, all calculated automatically, along with the benchmark guide.
Download the Free Current Ratio Calculator
Download the free Current Ratio Calculator below — no email signup required.
Download the Free Current Ratio Calculator (.xlsx)
Need this template customized to your business — a different setup, extra categories, or your own formulas built in? Email me at sharafudin1999@gmail.com or drop a comment below and I’ll help you tweak it.
Current Ratio pairs naturally with our Quick Ratio Calculator, Working Capital Calculator, and Balance Sheet Template for a fuller liquidity picture. For more on how this ratio is used, see Corporate Finance Institute’s overview of the current ratio, the same number this current ratio calculator returns.
Frequently Asked Questions
What is a good current ratio?
Most small businesses aim for somewhere between 1.5x and 3.0x. Below 1.0x means current liabilities exceed current assets, which is a real short-term liquidity risk. Above 3.0x is safe but can mean cash or inventory isn’t being put to productive use.
What’s the difference between current ratio and quick ratio?
Current ratio includes every current asset, inventory included. Quick ratio deliberately excludes inventory, since it can take time and sometimes a markdown to convert to cash. Quick ratio is the more conservative liquidity measure of the two.
Is a current ratio of 1.0 bad?
Not automatically. A ratio of exactly 1.0x means current assets just cover current liabilities, with no cushion. Some businesses with fast, predictable cash conversion operate comfortably at or near 1.0x, but it leaves little room for a slow month or a late-paying customer.
How often should I calculate my current ratio?
Monthly or quarterly is typical, and more frequently if your business has seasonal swings in inventory or receivables, or is managing tight liquidity.
Does current ratio include cash?
Yes — cash and cash equivalents are the most liquid current asset and the first line item in the current ratio calculation, alongside marketable securities, accounts receivable, inventory, and prepaid expenses.
