
Every business with a budget eventually asks the same question: did we actually hit it? Most owners answer that with a glance at the bank balance or a quick “revenue was up, so we’re fine.” Neither one tells you what you need to know. The bank balance mixes in loan payments and unpaid invoices. And a P&L on its own, as we’ve covered in our Profit and Loss Statement Template guide, only tells you what happened — not whether it happened the way you planned.
Budget vs. actual analysis is the step that connects the two. It takes the same P&L you already build every month and lines it up next to what you expected, line by line, so a shrinking margin or a runaway expense category shows up while it’s still a small problem instead of a year-end surprise.
Want new templates emailed to you?
No spam. Unsubscribe anytime. Downloads never require this.
What Is Budget vs. Actual (Variance) Analysis?
Budget vs. actual analysis — also called variance analysis — is the practice of comparing your planned numbers (the budget) to what actually happened (the actuals), line by line, and quantifying the gap between them. The gap itself is called the variance, and it’s usually expressed two ways: as a dollar amount and as a percentage.
It sounds simple because it is simple. Revenue budgeted at $50,000 and revenue actual at $46,500 is a $3,500 unfavorable variance, or about 7% under plan. The value isn’t in the arithmetic — it’s in doing that same comparison for every meaningful line on the P&L, every month, consistently enough that a pattern shows up before it becomes expensive.
Why This Matters More Than Reading the P&L Alone
A P&L tells you whether the business made money. It doesn’t tell you whether it made the money you expected, from the sources you expected, while spending what you expected to spend. Two very different businesses can produce the same net income: one that hit its revenue target and controlled costs as planned, and one that missed revenue badly but got lucky on an expense line that happened to run under budget. The bottom line looks identical. The businesses are not.
Budget vs. actual analysis is what separates those two stories. It’s also, practically speaking, an early warning system. A single month where marketing spend runs 40% over budget might be a one-off. Three months in a row is a trend that will quietly erode margin if nobody’s tracking it against a plan — which is exactly why watching the net income dollar figure and ignoring the details underneath it tends to compound over time rather than correct itself.
The Variance Analysis Formula
Two numbers matter for every line item: the dollar variance and the percentage variance.
Dollar variance = Actual − Budget
Percentage variance = (Actual − Budget) ÷ Budget
The dollar figure tells you the size of the problem in real terms — a $200 miss and a $20,000 miss are not the same conversation, even if both are “10% over.” The percentage tells you the scale relative to what you planned, which matters because a small line item can swing wildly in percentage terms without actually threatening anything.
Favorable vs. Unfavorable Isn’t the Same Direction for Every Line
This trips people up more than the math does. For revenue, actual coming in above budget is favorable. For an expense line, actual coming in above budget is unfavorable — you spent more than planned. Flip it around for actual coming in below budget. It’s worth labeling every variance explicitly as favorable (F) or unfavorable (U) rather than trusting the sign of the number, because a negative variance on an expense line is actually good news, and it’s easy to misread at a glance.
How to Build a Budget vs. Actual Report From Your P&L
If you’re already using our Profit and Loss Statement Template, you have the actuals half of this report built already — it’s the same multi-step structure, just with two more columns added.
- Keep your P&L’s existing structure. Revenue, COGS, gross profit, operating expenses, operating income, net income — the same waterfall, unchanged. Variance analysis works because it’s comparing like to like, not because it needs a new format.
- Add a Budget column next to Actual, for every line — not just the bottom line. This is the step people skip. A budget vs. actual report that only compares net income to a net income target hides exactly the information you need: whether a revenue problem is being masked by an expense underspend, or the reverse.
- Add a Variance ($) column and a Variance (%) column. Use the formulas above. Do this for every row, including subtotals like gross profit and operating income — a healthy net income variance can still be hiding an unhealthy gross margin variance underneath it.
- Mark each variance F or U, and consider conditional formatting (red/green) so problem lines are visible without reading every number.
- Repeat monthly, and add a year-to-date version. A single month’s variance can be noise. The YTD column is what shows you whether it’s a trend.
Where the “Budget” Number Actually Comes From
A budget vs. actual comparison is only as useful as the budget half of it. A few common starting points, roughly in order of effort:
Prior-year actuals plus a growth assumption. Take last year’s monthly numbers and apply a target growth rate. Fast to set up, reasonably accurate for stable businesses, weak for anything seasonal or growing quickly.
Zero-based budgeting. Build each line up from assumptions (units sold × price, headcount × salary, etc.) rather than adjusting a prior number. Slower to build, far more accurate, and it forces you to state your assumptions explicitly — which makes investigating variances later much easier, since you already know what you assumed.
Rolling forecast. Instead of one static annual budget set in January and never revisited, update the plan for the next 3-12 months every quarter based on what you now know. This is the version most businesses graduate to once static annual budgets start feeling disconnected from reality by Q3.
Whichever method you use, the budget needs to exist at the same level of detail as your P&L — a single annual revenue number divided by twelve is a reasonable starting point, but it will produce a “variance” every month in a seasonal business that isn’t a real problem, just a mismatched budget.
Setting a Materiality Threshold
Not every variance deserves a meeting. Without a rule for what’s worth investigating, budget vs. actual analysis turns into chasing $40 differences on the office supplies line while a real problem sits two rows down. A simple, commonly used rule: flag a line if it’s off by more than roughly 5-10% and more than a fixed dollar amount that makes sense for your business size (for a small business, often somewhere between $250 and $1,000, depending on the line).
The dollar floor matters as much as the percentage. A 40% variance on a $50 line is a $20 rounding difference. A 4% variance on an $80,000 revenue line is $3,200 — worth a conversation even though the percentage looks small.
A Worked Example
Here’s a simplified monthly comparison for a small service business:
| Line | Budget | Actual | Variance ($) | Variance (%) | F/U |
|---|---|---|---|---|---|
| Revenue | $50,000 | $46,500 | -$3,500 | -7% | U |
| COGS | $20,000 | $21,200 | +$1,200 | +6% | U |
| Gross Profit | $30,000 | $25,300 | -$4,700 | -16% | U |
| Operating Expenses | $18,000 | $16,800 | -$1,200 | -7% | F |
| Operating Income | $12,000 | $8,500 | -$3,500 | -29% | U |
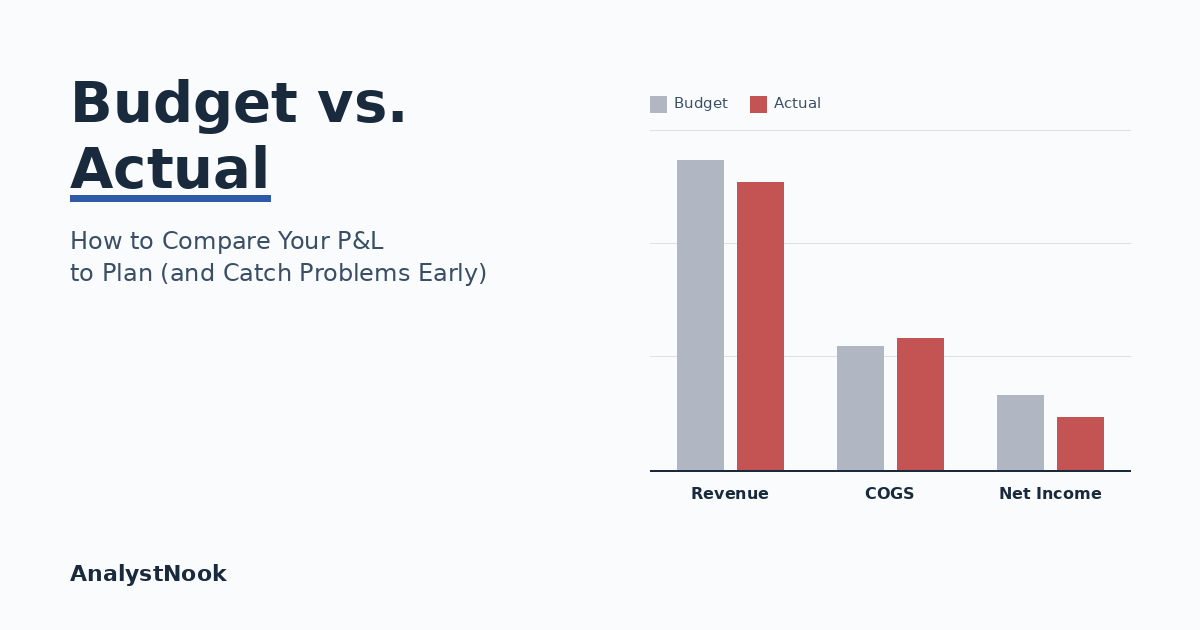
Read the bottom line alone and it looks like a rough month — operating income missed by 29%. Read the full table and the story is more specific: revenue came in soft (7% under plan, worth investigating whether it’s fewer sales or slower-paying clients), COGS crept up at the same time revenue dropped (a 6% overspend while volume was down is a real flag — costs should generally track down with lower revenue, not up), and operating expenses were actually well-controlled, running under budget. The real conversation this month is about pricing or cost of delivery, not about spending discipline — a distinction the net income number alone never would have surfaced.
Common Causes of Variances (and How to Investigate Each)
Timing. An invoice sent late, a client payment that slipped a few weeks, or an expense that landed in the wrong month can all create a variance that reverses itself next period. Check the calendar before assuming a trend.
Price vs. volume. A revenue miss can come from selling fewer units or from discounting more than planned — same dollar variance, completely different fix. Break revenue into units × average price when this happens, even if your regular P&L doesn’t.
One-off or non-recurring items. A single large expense — a legal fee, an equipment repair, a one-time bad debt write-off — can blow a monthly variance without indicating anything ongoing. Flag these separately so they don’t get averaged into a “trend” that isn’t real.
Seasonality the budget didn’t account for. If the budget was built by dividing an annual number by twelve, every seasonal business will show variances that are really just a bad budget shape, not a performance problem.
The original assumption was simply wrong. Sometimes the honest answer is that the budget was optimistic, or built on a growth rate that didn’t hold up. That’s a useful finding too — it means the next budget cycle needs a better assumption, not that the business underperformed.
The Monthly Review Checklist
- Pull actuals from the same P&L structure you already use every month.
- Compare every line to budget — not just net income — and calculate both dollar and percentage variance.
- Apply your materiality threshold and only dig into what clears it.
- For each flagged line, identify which cause above it most likely is before assuming the worst.
- Update the year-to-date variance, not just the current month, to separate noise from trend.
- Note anything that should change next quarter’s budget or forecast.
Common Mistakes to Avoid
Comparing only the bottom line. As the worked example shows, net income can look fine while gross margin and operating expenses are moving in opposite, offsetting, and individually concerning directions.
No materiality threshold. Without one, every variance gets equal attention, which in practice means none of them get enough.
A budget that’s never updated. A static annual budget built in January and never revisited becomes less useful every month that passes — by Q4 it’s measuring the business against an outdated guess rather than a meaningful plan.
Comparing to last year instead of to plan. “Up 12% versus last year” and “7% under this year’s budget” can both be true at once, and they answer different questions. Growth versus history is useful context; performance versus plan is what variance analysis is actually for.
No owner assigned to a variance. A flagged line with nobody responsible for explaining it tends to get flagged again next month, unresolved.
Frequently Asked Questions
What’s a good variance threshold to use?
There’s no universal number, but a common starting rule for a small business is roughly 5-10% combined with a fixed dollar floor (often a few hundred to around a thousand dollars, depending on your revenue size). The right threshold is whatever catches a real problem without generating a report full of noise every month — adjust it after a quarter or two of use.
Is budget vs. actual the same as forecast vs. actual?
They’re related but not identical. A budget is typically a fixed plan set once, often annually. A forecast is a living estimate that gets updated as the year goes on. Comparing actuals to the original budget tells you how the year is tracking against the original plan; comparing actuals to the latest forecast tells you how accurate your most recent thinking was. Mature finance teams often track both.
Should I compare monthly or year-to-date?
Both, ideally. A single month’s variance can be timing noise that reverses next month. The year-to-date comparison is what reveals whether something is a genuine, building trend rather than a one-off.
Do I need special software, or can I do this in Excel?
Excel is genuinely fine, and for most small businesses it’s the simplest option — you’re just adding Budget, Variance ($), and Variance (%) columns next to the Actual column you already have in your P&L. Dedicated FP&A software adds automation once a business has many cost centers or departments to consolidate, but it isn’t a prerequisite for doing this well.
What if I don’t have a formal budget yet?
Start simple rather than skipping the exercise. Even a rough budget — last year’s actuals plus a target growth rate — gives you something to measure against, and the comparison itself will show you where the estimate needs to get more precise next cycle.
Put It to Work This Month
You don’t need a new system to start doing this — you need two extra columns. Take the Profit and Loss Statement Template you’re already using, add a Budget figure and a Variance column next to each line, and apply the threshold above before your next monthly close. If cash timing is part of what’s driving a variance, pair it with our Cash Flow Forecast Template to see whether the gap is a performance issue or simply a timing one.
Download the Free Budget vs. Actual Template
Want to build your own budget vs. actual report without setting up the formulas from scratch? Download the free template below — it’s pre-loaded with the same materiality threshold and Flag? column used in the worked example above, plus a Monthly Trend tab so you can track budget vs. actual variances every month. No email signup required.
