
A burn rate calculator answers a question most small business owners never actually run the numbers on: how many months of cash runway do you have left at your current rate of spending? A business can be profitable on paper and still run out of cash, and a business that’s losing money on paper can have years of room to fix it, the calculator (paired with the runway math below) tells you which one you’re actually looking at, using your real cash balance and real monthly cash movement instead of guesswork.
The calculation itself is short — current cash divided by net burn — but the number is only useful if you’re honest about what’s going in and out each month, and most spreadsheets people build for this stop at a single static number instead of showing what happens if spend or revenue changes. The free burn rate and runway calculator below does both: it gives you today’s runway in months, then lets you stress-test it against a higher expense load, a new hire, or a slower revenue month, and charts your cash balance declining to zero so you can see the cliff coming before you’re standing on it.
What’s Inside the Free Burn Rate Calculator
The download is a single Excel file, pre-loaded with sample numbers so you can see how it behaves before entering your own. It covers your current monthly burn rate in both gross and net terms, your cash runway in months, a sensitivity table showing how runway shifts if spend rises or falls, a section for modeling the cash impact of a new hire or expense before you commit to it, and an 18-month cash balance projection that feeds a built-in chart showing exactly when the balance runs out.
How to Calculate Burn Rate: Gross Burn, Net Burn, and Runway
These three terms get used loosely, but each one answers a different question. Investopedia’s overview of burn rate covers the general concept, but a burn rate and runway calculator built around your own numbers is what actually tells you how many months of cash you have left.
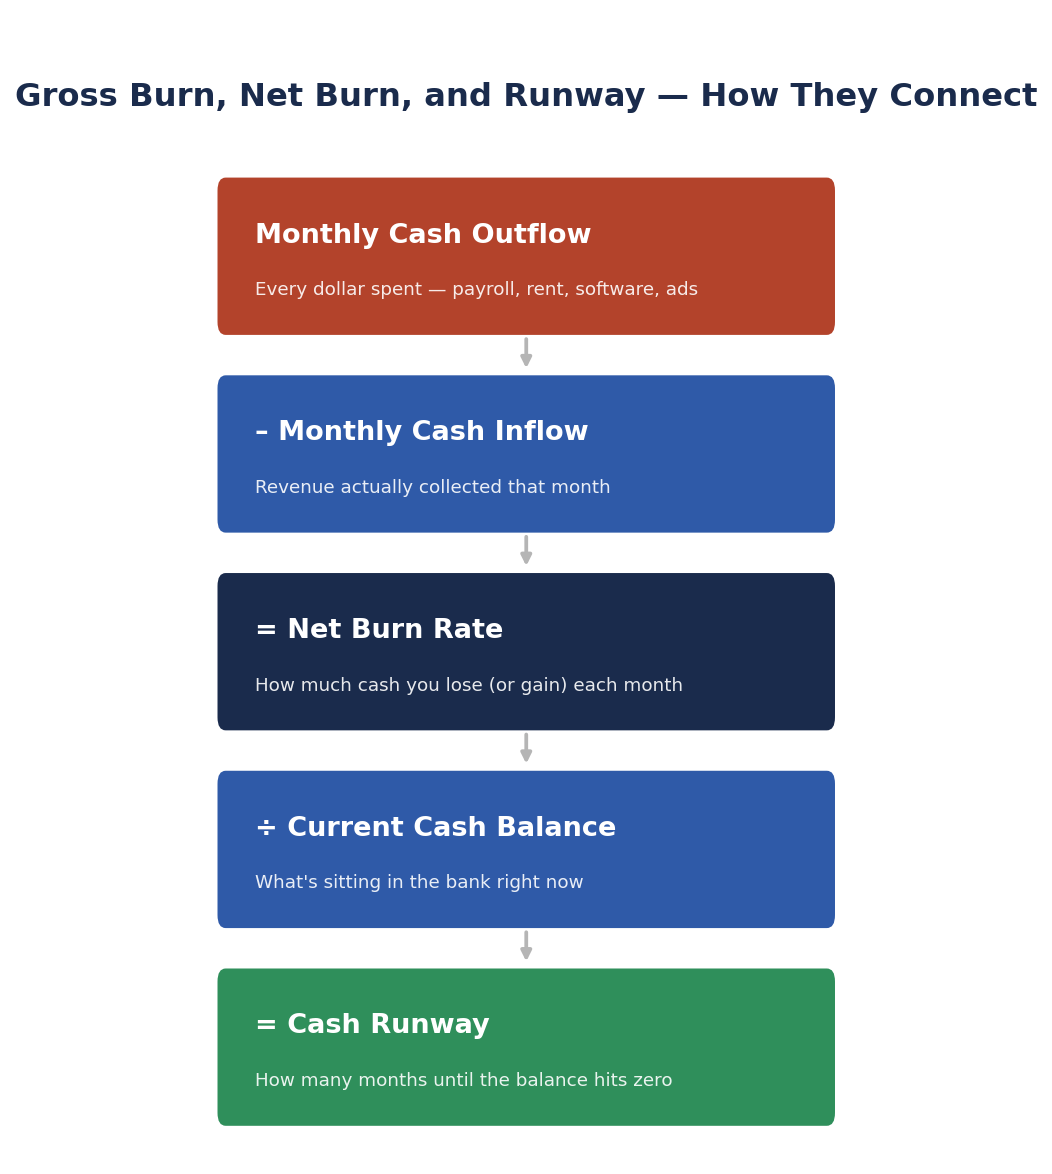
Monthly Cash Outflow
Every dollar that leaves the business in a month — payroll, rent, software subscriptions, ad spend, contractor invoices. This is your total spend, before anything is netted against revenue.
Monthly Cash Inflow
Revenue actually collected in cash that month, not revenue invoiced or booked. If a client pays 45 days late, that cash shows up in the month it lands in the bank, not the month you did the work.
Gross Burn Rate
Simply your monthly cash outflow on its own. It tells you the size of your spending, but nothing about whether the business can sustain it — a company with $200,000 in monthly revenue and $180,000 in gross burn is in a very different position than one with no revenue at all.
Net Burn Rate
Monthly cash outflow minus monthly cash inflow. This is the number that actually matters for survival — it’s how much cash the business is losing (or, if inflow exceeds outflow, gaining) every month. A business can have a high gross burn and still be fine, as long as revenue keeps pace.
Cash Runway (Months of Runway)
Current cash balance divided by net burn rate. This is the number of months left before the account reaches zero if nothing changes. It’s the single most important number for any business that isn’t yet consistently cash-flow positive, because it sets the deadline for every other decision — fundraising, cost cuts, or a revenue push.
Burn Rate and Runway vs. a Cash Flow Forecast
Burn rate and runway give you a fast, single-number snapshot: at today’s spending pace, how much time is left. A cash flow forecast goes further — it projects inflows and outflows month by month, accounting for seasonality, one-time expenses, and timing gaps between when revenue is earned and when it’s actually collected, rather than assuming next month looks like this month’s average.
In practice, the two work well together. Burn rate and runway is the number you check weekly to know where you stand right now; a full cash flow forecast is what you build before a major decision — hiring a round of new staff, signing a longer lease, or planning the next twelve months — because it accounts for the lumpy, uneven reality of cash timing that a flat average burn rate can’t capture.
How Runway Connects to Your Financial Model
Burn rate is a symptom of everything else happening in the business — pricing, headcount, sales cycle length, payment terms. A 3-statement financial model shows where that burn is actually coming from and how it’s projected to change as revenue and headcount grow, which is what turns “we have 7 months left” into “we have 7 months left, and here’s the plan that gets us to breakeven before month 6.”
If your runway number keeps surprising you month to month, that’s usually a sign the burn rate calculation is being done in isolation instead of being tied back to a full model of the business — worth building once revenue and cost lines are complex enough that a single burn number stops telling the whole story.
Common Burn Rate and Runway Mistakes
A handful of errors show up again and again in a burn rate calculator, and they all make the runway number look better than reality.
Using revenue booked instead of cash collected. If a client owes you money but hasn’t paid yet, that revenue isn’t cash in the bank. Using booked or invoiced revenue instead of actual cash collected overstates your inflow and makes runway look longer than it is.
Ignoring one-time or lumpy expenses. Annual software renewals, a security deposit, a one-time legal bill — these distort a single month’s burn rate badly in either direction. A burn rate based on one unusual month isn’t a reliable number; it’s worth averaging over two or three recent months instead.
Forgetting upcoming known costs. A new hire who starts next month, a rent increase already signed, a loan payment about to begin — none of these show up in last month’s burn rate, but they will hit runway hard once they start. The hiring-impact section in the calculator exists specifically to model this before it happens, not after.
Treating runway as fixed instead of a moving target. Runway isn’t a number you calculate once — it changes every time revenue, spend, or the cash balance moves. Recalculating monthly, or after any material change, is what keeps the number trustworthy enough to make decisions on.
Not stress-testing the downside. A runway calculated only on the current, optimistic trend hides how fast things get tight if revenue slows or a big customer churns. The sensitivity table exists to answer “what if spend runs 10-20% higher than expected” before that’s the actual situation.
How to Use This Burn Rate Calculator
Start with Section 1 of the burn rate and runway calculator: enter your current cash balance and your real monthly cash inflow and outflow, and it returns your gross burn, net burn, and runway in months immediately. If net burn comes out zero or negative, the business is cash-flow positive and runway doesn’t apply in the usual sense — that result is a good sign, not an error.
Use Section 2 to see how sensitive your runway is to spending changes — this is useful heading into budget planning or before approving new recurring costs. Section 3 lets you model one specific decision, like hiring a new employee or adding a new tool subscription, by entering its added monthly cost and seeing the new runway before committing. Section 4 turns the numbers into a month-by-month projection and chart, which is often the clearest way to communicate the runway situation to a co-founder, investor, or lender without walking through the formula each time.
Frequently Asked Questions
What’s a healthy amount of runway for a small business?
There’s no single number that applies to every business, but running the numbers through a burn rate and runway calculator regularly, many operators aim to keep at least 6 to 12 months of runway on hand, since that’s roughly how long it can take to meaningfully cut costs, raise financing, or grow revenue enough to change the trajectory. Under 3 months of runway generally means immediate action is needed rather than gradual planning.
Is burn rate the same as being unprofitable?
Not exactly. Burn rate is about cash moving through the bank account; profitability is about revenue and expenses on an accounting basis, which can include non-cash items and timing differences. A business can be profitable on paper while still burning cash because of collections timing, and it can show an accounting loss while actually holding cash steady due to non-cash charges like depreciation.
Should I use gross burn or net burn to calculate runway?
Net burn is the correct number for runway, since it already accounts for the cash coming in from revenue. Gross burn on its own overstates how fast you’re running out of money for any business with meaningful revenue — it only equals net burn for a business with no cash inflow at all.
How often should I recalculate my runway?
Monthly at a minimum, and immediately after any major change — a new hire, a lost customer, a pricing change, or a new round of funding. Runway calculated from data that’s a few months stale can be dangerously misleading right when a business is closest to the edge.
My net burn is negative. What does that mean?
A negative net burn means monthly cash inflow exceeds monthly cash outflow — the business is generating more cash than it’s spending, and the cash balance is growing rather than shrinking. In that case, “runway” in the traditional sense doesn’t apply, since there’s no month where the balance is projected to hit zero at the current rate.
What’s a good burn rate for a startup?
There’s no universal number — it depends entirely on your runway and growth stage. A pre-seed startup burning $30k a month with 18 months of runway is in a very different position than a Series A company burning $200k a month with the same runway. Rather than benchmarking against a single “good” burn rate, use a runway calculator to see how your specific burn compares to your fundraising timeline, or start from the cash runway template above if you want the full sensitivity table built in.
Download the Free Burn Rate and Runway Calculator
Download the free burn rate and runway calculator below — no email signup required. It’s pre-loaded with realistic sample numbers so you can see exactly how gross burn, net burn, and runway move together before you clear it out and enter your own.
Want new templates emailed to you?
No spam. Unsubscribe anytime. Downloads never require this.
Looking for more small business finance tools? Check out our Cash Flow Forecast Template, our Financial Model Template, or our Break-Even Calculator for related planning tools.
