
Most founders build their first cap table in a rush — usually right before an investor asks to see one — and end up with a spreadsheet that’s technically right today but breaks the moment a new hire gets an option grant or a new round closes. A cap table isn’t a one-time document; it’s a running record of exactly who owns what, and it needs to stay accurate every time ownership changes.
The free cap table template below gives you a structure that holds up past the first version: a shareholder-by-shareholder ownership table with fully-diluted percentages calculated automatically, a valuation section that turns a post-money number into a price per share, and a second tab that models exactly how much a new funding round will dilute everyone who’s already on the table.
Understanding Cap Tables
What Is a Cap Table Template?
A capitalization table — cap table for short — is a record of every owner of a company’s equity: founders, employees with option grants, and every investor who’s put money in, along with how many shares or options each one holds. (Investopedia has a good primer on the formal definition.) A cap table template is simply a pre-built version of that structure, with the ownership math, percentages, and valuation formulas already set up so you only need to enter your own shareholders and numbers rather than building the calculations from scratch.
Importance of Cap Tables for Startups
A cap table is one of the first documents any serious investor asks to see, because it answers the question they actually care about before writing a check: who owns this company right now, and how much of it will I own if I invest? It’s also the document founders themselves rely on to understand their own dilution — how much of the company they still own after each round — and it’s what a lawyer or option-pool administrator uses to make sure every grant is accounted for correctly.
Getting it wrong, or letting it fall out of date, tends to surface at the worst possible time: during due diligence for a funding round or an acquisition.
Key Components of a Capitalization Table
Every cap table needs the same core columns regardless of how simple or complex the company’s ownership is: the shareholder’s name, their share class (common, preferred, or options), the number of shares or options they hold, the price they paid per share, and their resulting ownership percentage. From those five inputs, everything else — total shares outstanding, price per share at a given valuation, and each shareholder’s dollar value — can be calculated rather than entered by hand.
How to Create a Cap Table
Building a cap table from a blank sheet is more error-prone than it needs to be, mainly because it’s easy to miscount fully-diluted shares if the option pool isn’t handled consistently — exactly what a cap table template is built to prevent. Here’s the sequence that avoids that.
Step-by-Step Guide to Making a Cap Table
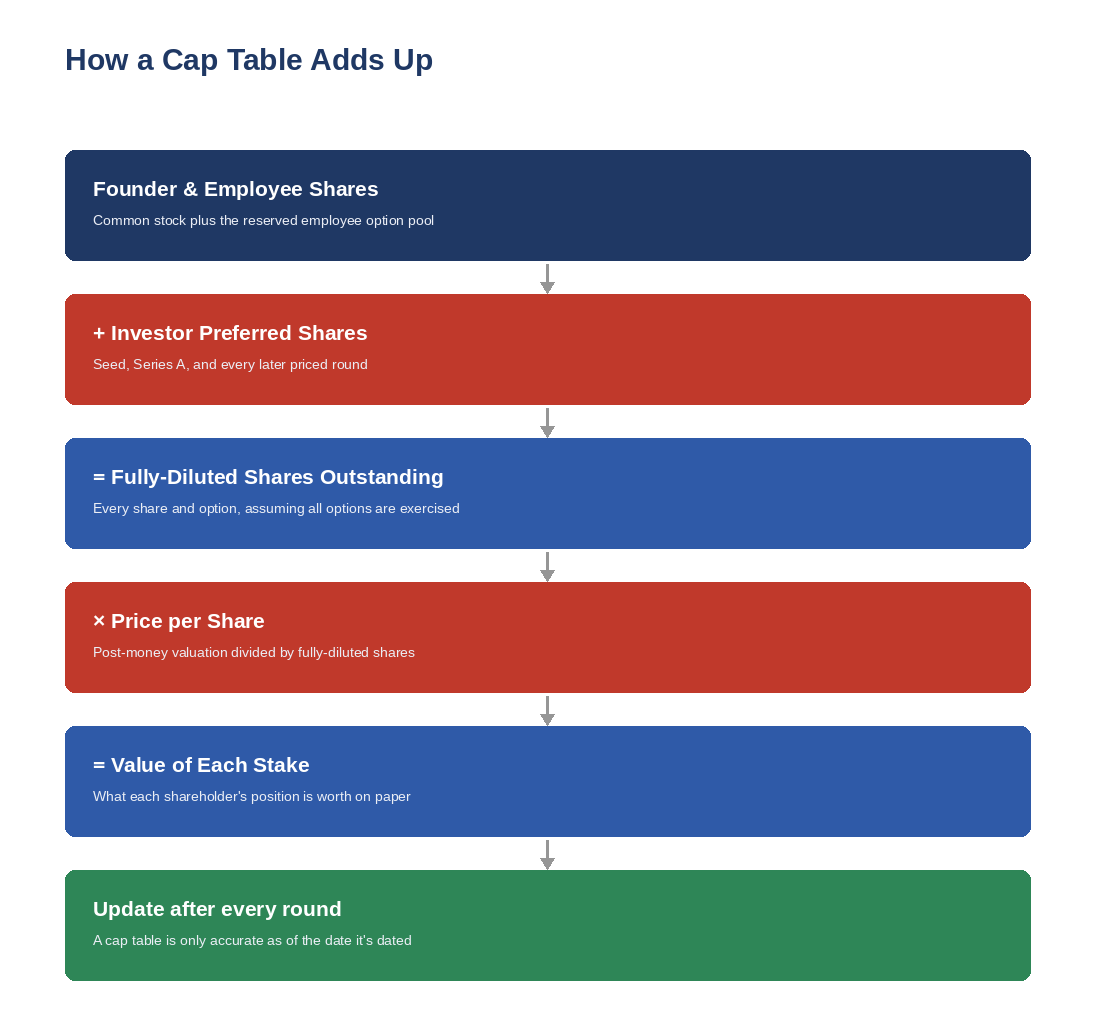
Start by listing every founder and their common share count exactly as set out in the founders’ agreement. Add the employee option pool as its own line — even the unallocated portion — because it counts toward fully-diluted shares whether or not every option has been granted yet. Then add each investor as a separate row by round, recording the share class (preferred, usually named after the round — “Preferred – Seed,” “Preferred – Series A”), the number of shares, and the price paid per share.
Total the shares column, then divide each row’s shares by that total to get each shareholder’s fully-diluted ownership percentage. Finally, if you know the company’s current post-money valuation, divide it by the total fully-diluted shares to get the implied price per share — that single number is what turns the whole table from a share count into a dollar value.
Using Excel for Cap Table Templates
Excel remains the standard for this even at companies that use dedicated cap table software later, because it’s transparent — anyone can see exactly how a percentage was calculated instead of trusting a black box. The template below uses ordinary formulas (a SUM for total shares, simple division for ownership percentages) so you can audit every number yourself, and extend it with new rows as your shareholder list grows, without needing to rebuild anything.
Cap Table Examples
Simple Cap Table Template Overview
The included template comes pre-loaded with a realistic post-seed example: two founders holding common stock, an employee option pool, and two seed investors holding preferred shares. It’s deliberately simple — five rows — so you can see exactly how the fully-diluted percentages and valuation math work before you replace the sample rows with your own company’s shareholders.
Cap Table Example for a Seed Round
In the sample data, two founders hold 8,000,000 common shares combined, a 900,000-share option pool is reserved for future employees, and two seed investors have purchased 1,600,000 preferred shares between them at $1.20 per share. That’s 10,500,000 fully-diluted shares in total. At a $12,600,000 post-money valuation, that works out to roughly $1.20 per share — which lines up with what the seed investors actually paid, since a clean seed round is priced at the post-money valuation the round itself sets.
Comparing Different Cap Table Formats
A basic cap table like the one here works fine for a seed-stage company with straightforward common and preferred shares. Once a company has multiple preferred share classes with different liquidation preferences, convertible notes or SAFEs that haven’t converted yet, or multiple option pools from different periods, the table needs additional columns to track each class’s specific rights — but the underlying structure (shareholder, class, shares, price, percentage) stays the same. It’s worth upgrading the format only when the complexity actually requires it; adding columns you don’t need yet just makes the table harder to read.
Cap Table Modeling Techniques
Understanding Equity Dilution
Dilution happens whenever new shares are issued — every existing shareholder still owns the same number of shares, but that number now represents a smaller slice of a bigger total. It isn’t inherently bad: a round that dilutes existing owners by 20% but triples the company’s value still leaves everyone better off in dollar terms, even though their percentage went down. The number worth watching isn’t the percentage alone — it’s the percentage combined with what the new capital is actually valued at.
Modeling Future Funding Rounds
The included Dilution Scenario tab lets you test a future round before it happens: enter a pre-money valuation and the amount you expect to raise, and it calculates the price per share, how many new shares that issues, and exactly how much existing shareholders get diluted as a result. Running this before a term sheet is signed — not after — is what lets a founder negotiate from an informed position instead of finding out the dilution number after the ink is already dry.
Best Practices for Cap Table Management
Update the cap table the moment any equity event happens — a new grant, a new investor, an option exercise — rather than batching updates for later, since it’s easy to lose track of exactly when something happened. Keep one row per shareholder rather than one row per certificate or grant, summing multiple grants to the same person. And treat the option pool as already-issued shares for fully-diluted math, even the unallocated portion, because that’s how investors will always evaluate it.
Common Cap Table Mistakes Founders Make
Forgetting the unallocated option pool. Shares reserved for future hires still dilute everyone else the moment the pool is created, not when individual grants are made. Leaving the unallocated portion out of fully-diluted shares makes every existing shareholder’s percentage look higher than it actually is.
Confusing basic and fully-diluted ownership. Basic ownership counts only shares actually issued today; fully-diluted ownership assumes every option and convertible instrument converts to shares. Investors almost always mean fully-diluted when they ask about ownership percentage — quoting the basic number instead will look like an error, not a favorable answer.
Not updating after every round. A cap table that’s accurate as of eighteen months ago isn’t a cap table anymore — it’s a historical document. Update it the same week any new shares or options are issued.
Ignoring liquidation preferences. A basic cap table shows ownership percentage, but percentage alone doesn’t tell you what each shareholder actually walks away with in an exit, especially once preferred shares carry liquidation preferences. That’s a separate calculation from the ownership table itself, but it’s worth knowing it exists before assuming percentage equals payout.
How to Use It
Replace the five sample rows in this cap table template with your own founders, option pool, and investors — enter the share class, shares held, and price paid per share for each, and the fully-diluted percentages and totals recalculate automatically. Enter your company’s current post-money valuation to see the implied price per share. Then, before agreeing to any new round, switch to the Dilution Scenario tab and enter the proposed pre-money valuation and raise amount to see exactly how much you and your existing shareholders will be diluted before you sign anything.
Frequently Asked Questions
What is a cap table example?
A cap table example is a sample ownership table showing how the shareholder, share class, shares held, and ownership percentage columns fit together in practice. The template above includes a realistic post-seed example with two founders, an option pool, and two seed investors, so you can see the math before entering your own company’s numbers.
What is a capitalization table?
A capitalization table is the full name for what’s commonly shortened to a cap table — a record of every shareholder in a company, how many shares or options each one holds, and what percentage of the company that represents, including shares that haven’t been issued yet but are reserved in an option pool.
How do I make a cap table if my startup only has founders so far?
Start with just the founder rows and a reserved option pool, even before any employees are hired — most startups set aside 10-20% of fully-diluted shares for future hires from day one. That gives you a complete, accurate table you can simply add rows to as investors and employees come on board, rather than restructuring the whole thing later.
What is a cap table for a seed round supposed to look like?
At the seed stage, it’s typically short: one row per founder, one row for the option pool, and one row per seed investor or investor group. There’s usually no need for multiple preferred share classes yet — that complexity tends to show up starting at Series A, when earlier investors’ preferred terms need to be tracked separately from the new round’s.
How do warrants show up in a cap table?
Warrants are typically added as their own row, similar to options — they represent the right to purchase shares at a set price in the future, and they count toward fully-diluted shares the same way an unexercised option does. If a lender or landlord received warrants as part of a financing arrangement, they belong on the cap table exactly like any other equity holder, even though they aren’t an investor in the traditional sense.
Download the Free Cap Table Template
Download the free Cap Table Template below — no email signup required. It’s pre-loaded with a sample post-seed cap table so you can see exactly how the ownership and dilution math works before you clear it out and enter your own.
Want new templates emailed to you?
No spam. Unsubscribe anytime. Downloads never require this.
Looking for more small business finance tools? Check out our How to Value a Small Business guide, our Financial Model Template, and our Financial Modeling 101 guide.
