
Most small business owners build a budget once, glance at it a few times, and then run the actual business from their bank balance. A real financial model does something a budget can’t: it links your revenue, your costs, your balance sheet, and your cash together, so when you change one assumption — a slower month, a new hire, a loan — you can see exactly how it ripples through everything else. That’s the difference between guessing and planning.
The free template below is a genuine 3-statement model: an Income Statement, a Balance Sheet, and a Cash Flow Statement, fully linked with formulas across 12 months. Change the revenue growth rate or the owner’s draw in the Assumptions tab, and all three statements — and the balance check — recalculate instantly. It’s built to be the capstone of everything else on this site: it uses the same P&L logic, the same balance sheet structure, and the same cash flow mechanics as the standalone templates, just connected into one system.
What’s Inside the Free Financial Model Template
The download is a single Excel workbook with five tabs: Assumptions, Income Statement, Balance Sheet, Cash Flow Statement, and a Dashboard. Every yellow cell on the Assumptions tab is an input — starting revenue, monthly growth rate, cost of goods sold, fixed operating expenses, a loan balance and interest rate, an owner’s draw, and a tax rate. Everything else is a formula. The Income Statement projects 12 months of revenue and expenses down to net income. The Balance Sheet carries an opening column plus all 12 months, with a built-in balance check that confirms assets equal liabilities plus equity every single month. The Cash Flow Statement reconciles net income to the actual change in cash using the indirect method. The Dashboard pulls the headline numbers — total revenue, total net income, ending cash, ending loan balance — into one view, with a chart showing all three trending together.
How the Three Statements Connect
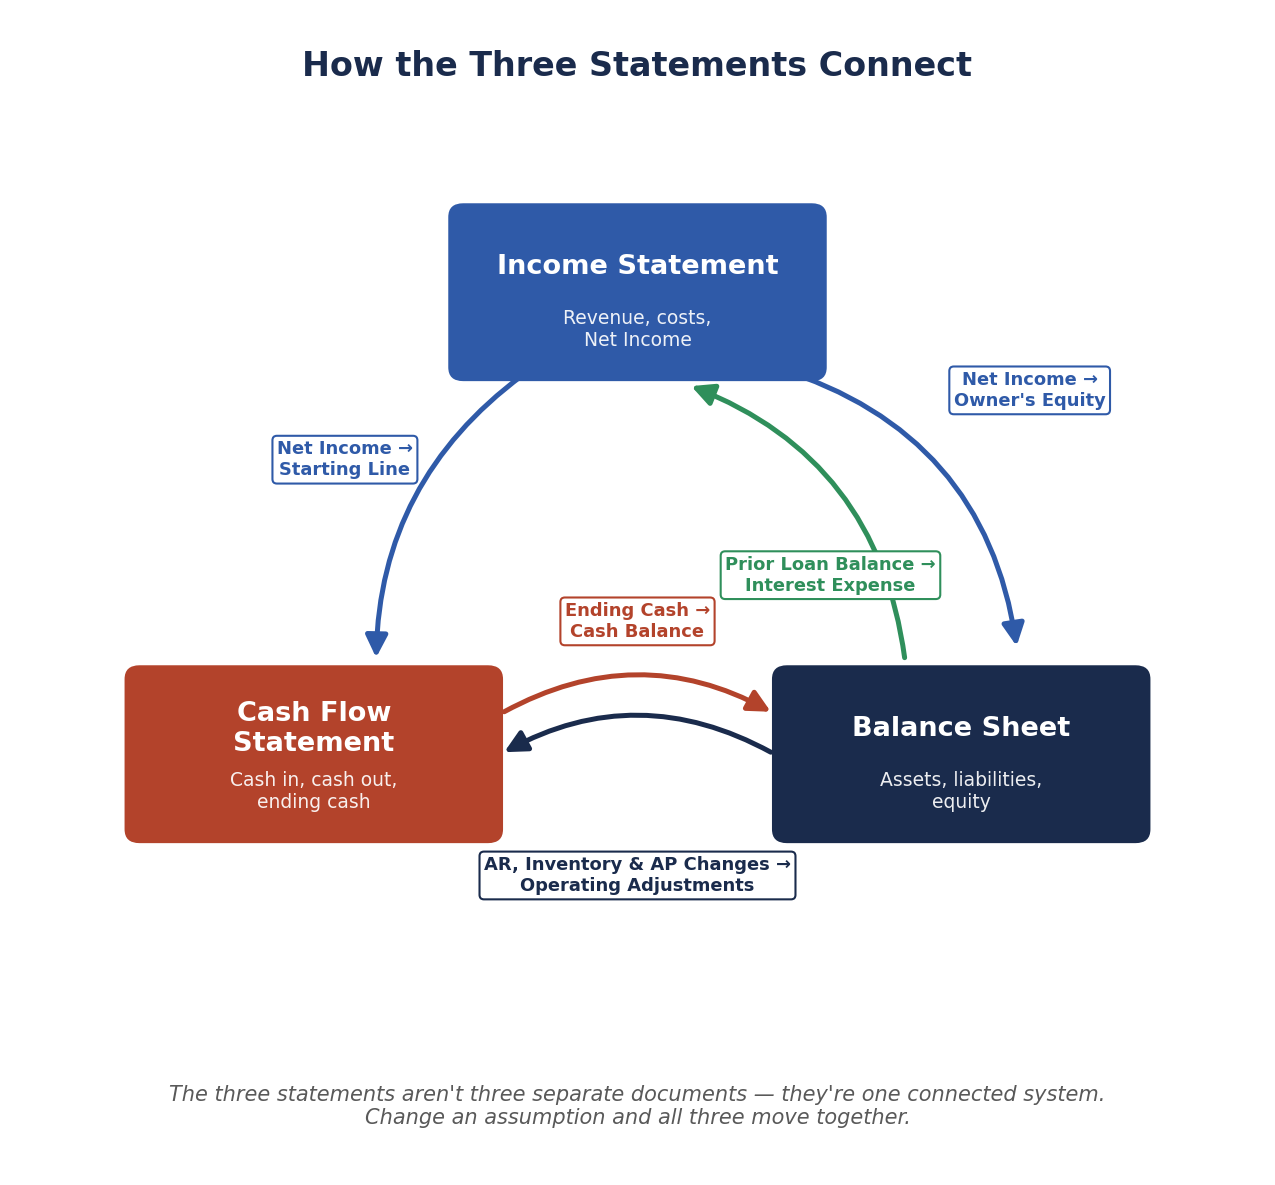
It’s easy to think of the income statement, balance sheet, and cash flow statement as three separate reports because that’s how accounting software presents them. In a real model, they’re one system, and each one feeds the others.
Net Income Flows Into the Balance Sheet
Every month’s net income from the Income Statement adds directly to Owner’s Equity on the Balance Sheet, minus whatever the owner draws out. Profit that isn’t paid out becomes part of what the business is worth.
Net Income Is Also the Starting Line of the Cash Flow Statement
The Cash Flow Statement doesn’t start from zero — it starts from net income, then adjusts for everything that affects cash but doesn’t show up on the income statement: depreciation, and changes in receivables, inventory, and payables.
Working Capital Changes Move Between the Balance Sheet and Cash Flow
If receivables go up, that’s revenue you’ve recognized but haven’t collected yet — cash goes down even though profit went up. If payables go up, you’re holding onto cash a little longer. These are exactly the adjustment lines in the middle of the Cash Flow Statement, and they’re pulled directly from the change in each Balance Sheet line from one month to the next.
Ending Cash Becomes Next Month’s Cash Balance
The Cash Flow Statement’s ending cash for the month becomes the Balance Sheet’s cash balance for that same month — and next month’s beginning cash. This is the link that makes the balance sheet balance: it isn’t a separate number you enter, it’s calculated.
The Loan Balance Feeds Back Into Interest Expense
The debt schedule runs in the background of the Balance Sheet: each month’s loan balance falls by that month’s principal payment, and next month’s interest expense is calculated directly from the prior month’s balance. That interest expense flows back up into the Income Statement, which is why this is genuinely circular — a change today affects a number three tabs away next month.
Why This Model Always Balances
Every input you change flows through the same three identities: Net Income raises Owner’s Equity, the Cash Flow Statement’s ending cash IS the Balance Sheet’s cash line, and every non-cash item that hits the Income Statement (depreciation, working capital movement) gets added back or subtracted in the Cash Flow Statement. As long as those three links stay intact, assets equal liabilities plus equity by construction, not by coincidence — which is exactly what the balance check row on the Balance Sheet tab confirms for all 12 months. This is the same logic behind a proper 3-statement financial model: it’s not three separate spreadsheets that happen to agree, it’s one structure where agreement is guaranteed by how the formulas are built.
Reading the Default Numbers: A Profitable Business That’s Still Tight on Cash
The template ships with realistic sample numbers already filled in, and they tell a story worth paying attention to. The business is profitable every single month — net income grows from about $1,600 in Month 1 to over $7,100 by Month 12. But look at the cash balance: it actually falls for the first several months, bottoming out around Month 7, before recovering and ending the year roughly 40% below where the owner’s capital and loan started it. A growing, profitable business can still run low on cash — because growth itself consumes cash (more receivables, more inventory) before it pays you back. This is the exact scenario our Cash Flow Forecast Template is built to catch on its own, and seeing it appear naturally inside a full 3-statement model is the clearest argument for why cash flow needs to be forecast separately from profit.
It’s worth putting a number on that dip rather than just eyeballing the chart. Feed the same monthly cash inflow and outflow into our Burn Rate and Runway Calculator and it converts that dip into a runway figure — how many months of cushion the business actually has before Month 7 arrives, and how much a spending increase would shrink that further.
Common Mistakes When Building a Financial Model
I build and review financial models for small business clients as part of my freelance analysis work, and the models that fall apart almost never fail on the formulas — they fail on the assumptions feeding them. These are the ones I flag first when I open someone else’s model for the first time:
A few mistakes show up constantly in first-time models, and most of them break the link between statements rather than any single number.
Treating the balance sheet as an afterthought. Plenty of homemade models are really just an income statement with a cash flow tacked on — the balance sheet gets skipped because it feels like the hardest part. It’s also the part that catches errors everywhere else, because if it doesn’t balance, something upstream is wrong.
Forgetting that revenue and cash are different things. Booking a sale on the income statement the moment it happens, then assuming the cash arrived on the same day, is the single most common reason a model looks healthier than the real bank balance. Accounts receivable exists specifically to hold that gap.
Hardcoding a number that should be a formula. The moment a “calculated” cell contains a typed-in number instead of a formula referencing the Assumptions tab, the model stops updating when assumptions change — and nobody notices until the numbers quietly stop making sense.
Ignoring depreciation. Buying equipment reduces cash immediately but expenses it slowly over its useful life. Skip the depreciation schedule and either the income statement understates the true cost of the asset, or the balance sheet keeps carrying it at full value long after it’s lost that much worth.
Building 40 tabs before validating the first three. It’s tempting to add scenario toggles, multiple product lines, and departmental breakdowns right away. Get one clean, balanced, 3-statement core working first — everything else is easier to layer on once that foundation actually ties out.
How to Use This Template
Using this financial model template starts with the Assumptions tab: replace every yellow cell with your own numbers — your actual starting revenue, your real fixed costs, your loan terms if you have one. Leave the sample numbers in place the first time through if you just want to see how the mechanics work before committing your own figures.
Once your assumptions are in, open the Balance Sheet tab and check the Status row along the bottom. Every column should read “OK.” If any column reads “CHECK,” it means a formula was overwritten somewhere — the fastest fix is to re-download a clean copy and re-enter only the yellow assumption cells rather than editing formulas directly.
From there, the Dashboard tab is built to be the page you actually look at week to week: total revenue, total net income, ending cash, ending loan balance, and the trend chart, all pulled automatically from the other three tabs.
Frequently Asked Questions
What is a 3-statement financial model?
A 3-statement model links the income statement, balance sheet, and cash flow statement with formulas instead of building each one separately. A change to any assumption — revenue growth, an expense, a loan — automatically flows through all three, so the model always stays internally consistent.
Do I need to be an accountant to use this?
No. The Assumptions tab is designed to take plain-English inputs — your monthly revenue, your costs, your loan details — and the model handles the accounting mechanics. Understanding the basic structure helps, which is what the Financial Modeling 101 guide walks through from the ground up.
How is this different from your Balance Sheet Template or P&L Template?
Those templates are single-point-in-time tools: you enter one period’s numbers and they calculate ratios or totals for that period. This model is forward-looking and dynamic — it projects 12 months forward from a set of assumptions, and the three statements are formula-linked to each other rather than filled in independently. Many people use the standalone P&L Template or Balance Sheet Template to check where they stand today, and this model to project where they’re headed.
Can I use this to raise money or apply for a loan?
It can absolutely support a conversation with a lender or investor, since it shows how your business would perform under a set of stated assumptions — but treat those assumptions honestly and be ready to explain them. For a one-time snapshot of what the business is worth today rather than a 12-month projection, pair this with our Small Business Valuation Calculator.
What if my business doesn’t carry inventory or debt?
Set Inventory Days and the loan-related assumptions to zero. The formulas are built to handle zero cleanly — the model will simply show no inventory balance and no interest expense, without breaking the balance check.
Download the Free Financial Model Template
Download the free 3-Statement Financial Model Template below — no email signup required. It’s pre-loaded with realistic sample numbers so you can see exactly how the three statements move together before you clear it out and enter your own.
Want new templates emailed to you?
No spam. Unsubscribe anytime. Downloads never require this.
Looking for more small business finance tools? Check out our Profit and Loss Statement Template, our Balance Sheet Template, or our Cash Flow Forecast Template for standalone versions of each statement.
