
It’s possible to have a business that’s growing — more orders, more customers, a busier calendar — and still be losing money on every single one of them. Revenue going up feels like progress, but revenue isn’t the same question as “does each sale leave me better off or worse off.” That’s exactly what a contribution margin calculator answers, and it’s the number that actually predicts whether growth will save your business or sink it.
Unit economics just means looking at the profit or loss on one unit — one product sold, one order fulfilled, one customer served — instead of the blurred-together total on your P&L. Once you know that number, decisions that used to be guesswork (raise prices or cut costs? take the big order or pass on it? is this new customer segment actually worth chasing?) become arithmetic. That’s the whole idea behind unit economics for small business: a small, repeatable calculation that tells you the truth about a sale, a customer, or an order — no accounting degree required.
Want new templates emailed to you?
No spam. Unsubscribe anytime. Downloads never require this.
What Unit Economics for Small Business Actually Means
Most of what shows up when you search “unit economics” is written for venture-backed startups, and it’s dominated by two terms: CAC (customer acquisition cost) and LTV (customer lifetime value). Those matter, and we’ll get to them, but they’re built for a specific case — a subscription or app business acquiring customers who stick around and pay repeatedly.
A lot of small businesses aren’t that. A bakery, a landscaping company, an e-commerce shop selling physical products, a boutique — these businesses need unit economics too, but the more useful starting question isn’t “what does it cost to acquire a customer,” it’s simpler: does this one sale, by itself, make money once you subtract what it actually cost to deliver it?
That’s a per-unit or per-order calculation, not a per-customer one, and it’s usually the more urgent number to know first. If you’re selling something at a loss, getting more customers to buy it doesn’t fix the problem — it multiplies it.
The Core Formula: Contribution Margin Per Unit
The building block of unit economics is called contribution margin, and it’s simpler than the name suggests.
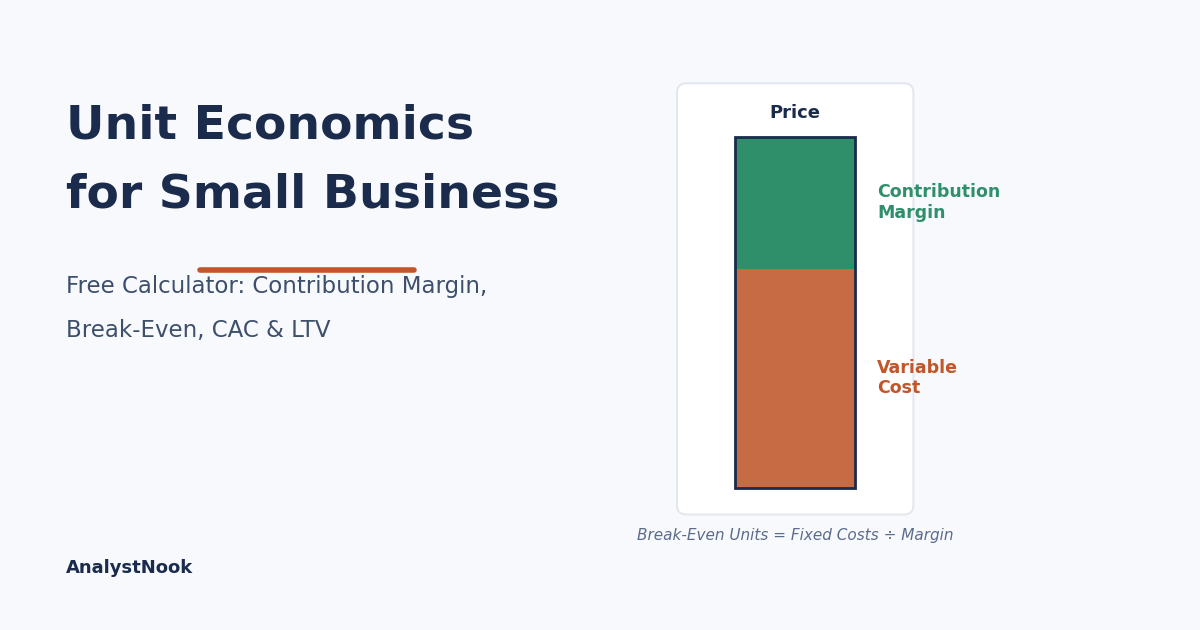
Contribution margin per unit = Price per unit − Variable cost per unit
Variable costs are the costs that scale directly with each sale: materials, packaging, per-unit shipping, payment processing fees, sales commissions, ingredients — anything that wouldn’t exist if that one sale didn’t happen. Fixed costs (rent, salaries, software subscriptions, insurance) don’t belong in this calculation; they matter for the next step, not this one.
Divide contribution margin by price and you get the contribution margin ratio — the percentage of every dollar of revenue that’s left after variable costs, before fixed costs even enter the picture. A $40 product with $25 in variable costs has a $15 contribution margin and a 37.5% contribution margin ratio. Every one of those units contributes $15 toward covering rent, salaries, and everything else that doesn’t move with sales volume — and, eventually, toward profit. Plugging your own numbers into a contribution margin calculator turns this formula into an answer in seconds instead of a spreadsheet exercise.
Break-Even: How Many Units You Need to Sell
Once you know the contribution margin per unit, break-even is one more step:
Break-even units = Total fixed costs ÷ Contribution margin per unit
If your fixed costs run $6,000 a month and each unit contributes $15, you need 400 units a month just to cover fixed costs — the 401st unit is where actual profit starts. This is the same break-even formula the U.S. Small Business Administration walks through in its own planning guide. This number reframes a lot of decisions. “We need more sales” becomes a specific target instead of a vague feeling, and it’s immediately obvious whether a slow month is a minor dip below breakeven or a structural problem with pricing or costs.
Our free Break-Even Calculator runs these numbers for you automatically, plus a target-profit and margin-of-safety version. Once your unit economics are healthy and consistent, that same profitability is also the foundation for what a buyer would pay for the business — see our Small Business Valuation Calculator to turn it into an estimated value.
Unit Economics for Service and Subscription Businesses
For a business built on recurring customers rather than one-off sales — a gym, a retainer-based service, a subscription box — the more useful version of unit economics shifts from “per unit” to “per customer,” and this is where CAC and LTV actually apply well:
- CAC (Customer Acquisition Cost) — total sales and marketing spend divided by the number of new customers it produced in that period.
- LTV (Lifetime Value) — average revenue per customer per period, multiplied by how many periods a customer typically stays, often adjusted for the margin on that revenue rather than the raw revenue itself.
- LTV:CAC ratio — LTV divided by CAC. A commonly cited healthy target is 3:1 or higher — each customer is worth about three times what it costs to acquire them.
- CAC payback period — how many months of revenue from a customer it takes to recover what you spent acquiring them. Shorter is better, since it’s less time your cash is tied up before that customer becomes profitable.
If you spend $150 to acquire a customer who pays $40/month at a 60% margin and stays for 10 months, that customer generates $240 in margin against a $150 acquisition cost — an LTV:CAC ratio of 1.6:1, and a payback period of roughly 6 months. That ratio tells you plainly whether your growth spending is building the business or quietly draining it.
Why Unit Economics Matters More Than Revenue Growth
The failure mode unit economics catches early is a specific and common one: a business that’s growing its top line while its per-unit or per-customer economics are negative or razor-thin. Every new sale under those conditions doesn’t add profit — it adds a little more loss, just spread across a bigger number that looks encouraging on a revenue chart. This is exactly the blind spot a contribution margin calculator is built to expose.
This is also why unit economics belongs upstream of a cash flow forecast: your forecast is only as sound as the per-unit assumptions feeding it, and it’s the same reasoning behind why contribution margin is one of the numbers worth tracking on an ongoing KPI dashboard rather than something you calculate once and file away.
What’s Inside the Free Contribution Margin Calculator
This free contribution margin calculator has two working tabs. The Per-Unit Calculator tab is for product and order-based businesses — enter your price and variable costs and it calculates contribution margin, contribution margin ratio, and break-even units and revenue automatically once you add your fixed costs. The Per-Customer Calculator tab is for service and subscription businesses — enter average revenue per customer, cost to serve, customer lifespan, and acquisition cost, and it calculates LTV, CAC payback period, and your LTV:CAC ratio.
How to Use It
Start with whichever tab matches how your business actually sells — most businesses lean toward one or the other, though plenty use both for different parts of their revenue. Plug in real numbers from a recent month rather than rough estimates; the output is only as useful as the inputs. If the break-even number or the LTV:CAC ratio looks worse than you expected, that’s the contribution margin calculator doing its job — it’s much cheaper to find that out in a spreadsheet than three months into a growth push.
Frequently Asked Questions
What’s a good contribution margin ratio for a small business?
It depends heavily on the industry — a services business might run 60-80%, while a physical product business with real materials and shipping costs might run 30-50%. There’s no universal target; the more useful comparison is against your own historical numbers and your direct competitors, and against what you need to cover fixed costs at a realistic sales volume. Running the numbers through a contribution margin calculator makes that comparison quick even if you only check it once a quarter.
Is unit economics the same as profit margin?
They’re related but not identical. Profit margin (net margin) accounts for every cost in the business, including fixed costs, over a period of time. Unit economics isolates a single unit or customer and, in its first step, deliberately ignores fixed costs — it’s a different lens on the same underlying business, useful for different decisions — a contribution margin calculator is built specifically for that first lens.
What counts as a “variable cost” versus a “fixed cost”?
The test is whether the cost would still exist if that specific sale never happened. Materials, per-unit shipping, and payment processing fees disappear if the sale doesn’t happen, so they’re variable. Rent, salaried payroll, and software subscriptions exist either way, so they’re fixed. Some costs are semi-variable (hourly staff scheduled around volume) and take judgment to categorize — when in doubt, categorize conservatively.
How do I calculate customer lifespan if I don’t have years of data yet?
Use churn rate as a shortcut: average customer lifespan (in months) is roughly 1 divided by your monthly churn rate. A business losing 5% of customers per month has an average lifespan of about 20 months. It’s an estimate, not a guarantee, but it’s far better than guessing outright, and it gets more accurate as you accumulate real retention data — plug your best estimate into the contribution margin calculator and refine it as the numbers firm up.
My LTV:CAC ratio is below 1:1 — does that mean I should stop acquiring customers?
Not necessarily, especially early on — some businesses intentionally acquire at a loss short-term to build a customer base, assuming the ratio improves with retention and repeat purchases over time. But a ratio that stays below 1:1 for an extended period is a real problem, not a phase, and it’s worth revisiting pricing, retention, or acquisition costs directly rather than assuming growth alone will fix it — the same contribution margin calculator inputs above will show you which lever moves the ratio fastest.
Download the Free Contribution Margin Calculator
Once you know each sale is profitable on a unit basis, our Profit and Loss Statement Template shows whether that profitability is holding up across the whole business, month over month.
