
A cash flow forecast template turns next year’s guesswork into a month-by-month picture of exactly when cash comes in, when it goes out, and how much you’ll actually have in the bank — before any of it happens. Below is a free, fully-built cash flow forecast template in Excel, plus a full walkthrough of how it works and why it’s built the way it is.
Most businesses that run into a cash crunch don’t fail because they were unprofitable — they fail because they ran out of cash while looking profitable on paper. This template exists to catch that gap months before it becomes an emergency.
Why a Cash Flow Forecast Isn’t the Same as a Profit & Loss
This forecasts cash, not profit — and the difference matters more than most spreadsheets admit. A sale you haven’t been paid for yet doesn’t belong in “cash in” until the money actually lands in the bank. A loan’s principal repayment shows up as cash out every month, even though it never touches your profit and loss statement. Buying equipment is a large one-time cash outflow, even though it only shows up on your P&L slowly, as depreciation, over several years.
A business can be profitable on paper and still run out of cash — waiting on invoices, carrying too much inventory, or making a large capital purchase can all drain the bank account while the income statement still looks healthy. A cash flow forecast template is the tool that catches that gap in advance. For a broader primer on the fundamentals, SCORE’s guide to cash flow management is a solid starting point.
What’s Inside the Free Template
This cash flow forecast template has four tabs, and you only ever type into one of them:
- Read Me — a one-page legend explaining the color coding and how the tabs connect.
- Monthly Inputs — the only tab you edit. Ten line items across cash in and cash out, for each of 12 months.
- Cash Flow Forecast — the month-by-month roll-forward: beginning balance, inflows, outflows, net cash flow and ending balance, fully wired to your inputs.
- Dashboard — the finished view: six scorecards and four charts, built entirely from formulas so they update the moment you change a number.
How the 12-Month Roll-Forward Works
Every column in the forecast is one month, and every month follows the same five-step chain — this is the actual mechanics of a cash flow forecast template, and once you see it, you can build one from scratch yourself.
1. Beginning Cash Balance
The cash sitting in the account on day one of the month. For January, that’s your actual current balance, typed in by hand. For every month after that, it’s simply last month’s ending balance — carried forward automatically, so you never type it in twice.
2. Cash Inflows
Formula: Cash Sales + Other Cash In. Everything that actually deposits money into the account that month — collected sales and anything else (a loan draw, an owner contribution, a tax refund).
3. Cash Outflows
Formula: the sum of every cash-out line — cost of goods sold, payroll, rent, marketing, loan payments, taxes, capital expenditures and other cash out. Anything that leaves the account that month, regardless of which month it shows up on the P&L.
4. Net Cash Flow
Formula: Cash Inflows − Cash Outflows. Positive means the account grew that month; negative means it shrank. A single negative month isn’t a crisis — several negative months in a row, with no plan to reverse it, is what a forecast is built to flag early.
5. Ending Cash Balance
Formula: Beginning Balance + Net Cash Flow. This becomes next month’s beginning balance, which is what makes the whole 12-month chain roll forward on its own. A running cumulative net cash flow total sits alongside it, so you can see at a glance whether the year as a whole is building cash or burning it.
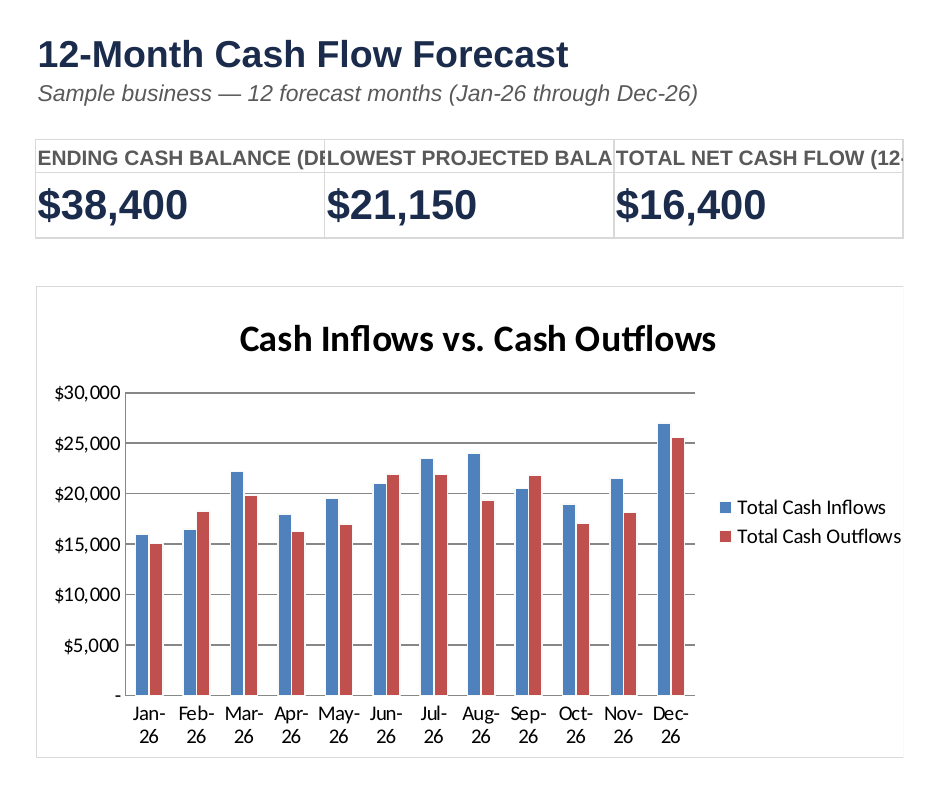
The Dashboard: 6 Numbers to Watch
The Dashboard tab turns your cash flow forecast template into six numbers you can check in under a minute:
- Ending Cash Balance (Dec) — where the year is projected to leave your bank balance.
- Lowest Projected Balance — the single tightest month all year. This is the number that tells you how much of a cushion you actually have.
- Total Net Cash Flow — cash generated or consumed across the full 12 months.
- Average Monthly Net Cash Flow — smooths out one-off months so you can see the underlying trend.
- Months With Negative Flow — a quick count of how many months burn more cash than they bring in.
- Total Cash Outflows — everything leaving the business over the year, all in one number.
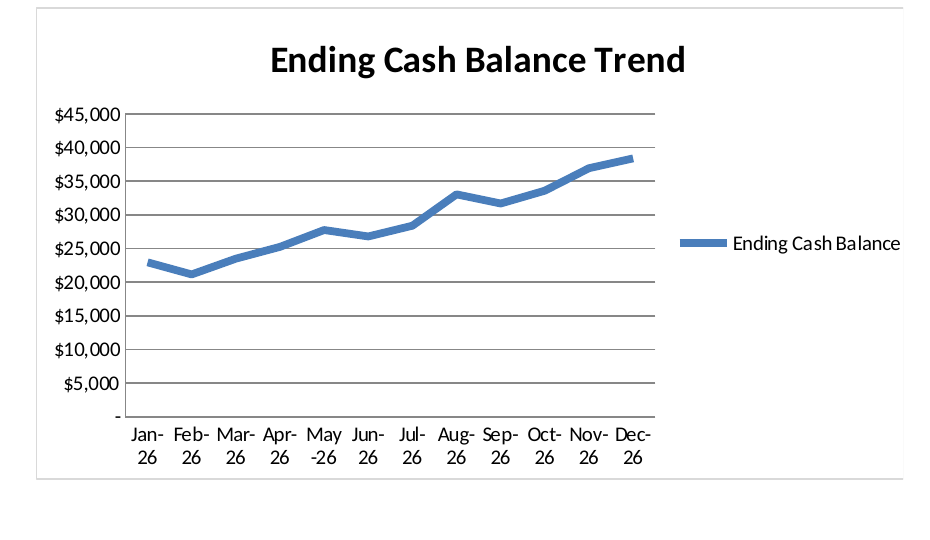
How to Use It Every Month
On the bookkeeping side of my own client work, the forecasts that actually get used are the ones opened on a fixed day every month — right after the bank account gets reconciled, while the numbers are still fresh. A forecast that only gets touched when cash feels tight is already too late to be useful. Here’s the routine that keeps it working:
- Once a month, open the Monthly Inputs tab and enter that month’s actual cash sales, other income, and every cash outflow line.
- Check your cash flow forecast template’s Dashboard tab — it’s already updated. No copying, no rebuilding charts.
- Watch the Lowest Projected Balance scorecard first. That’s your earliest warning of a tight month, months before it arrives.
- If Months With Negative Flow starts climbing, that’s your cue to look at spending, financing, or collections before it becomes urgent.
If the Lowest Projected Balance scorecard is trending toward zero, it’s worth translating that into a single number: how many months of runway that leaves at your current pace of spending. Our Burn Rate and Runway Calculator takes the same cash-in, cash-out inputs and turns them into that runway figure directly, plus a sensitivity table for what happens if spending creeps up.
Monthly Forecast vs. a 13-Week Cash Flow Forecast
This template rolls forward month by month, which is the right cadence for most small businesses planning six to twelve months out. If your cash position is tight enough that you’re watching it week to week — a seasonal business heading into a slow stretch, or a company managing a line of credit closely — a 13-week (rolling weekly) cash flow forecast is the better tool: same underlying logic of beginning balance, inflows, outflows, and ending balance, just compressed into weekly buckets so you catch a cash crunch with enough lead time to act on it. Most businesses don’t need both; start with the monthly version here, and only add a weekly layer once cash gets tight enough that a month is too coarse a unit to plan around.
Frequently Asked Questions
What’s the difference between a cash flow forecast and a cash flow statement?
A cash flow statement looks backward — it reports what actually happened to cash last month or last quarter. A cash flow forecast looks forward, projecting cash inflows and outflows for months you haven’t reached yet, so you can spot a shortfall before it happens instead of explaining it after the fact.
How far out should I forecast?
Twelve months is the standard planning horizon and what this template covers, but if cash is genuinely tight, layering in a rolling 13-week forecast alongside it gives you the weekly precision that a monthly view can miss.
What if my revenue is irregular or seasonal?
Build the forecast off your actual historical collection patterns rather than a flat monthly average — enter the low months as low and the high months as high. The template’s beginning cash balance carries forward automatically, so a rough patch in one month shows up honestly in the next rather than getting smoothed away.
My P&L shows a profit — why does the forecast show a cash shortfall?
This is the exact gap a forecast is built to catch: revenue and expenses hit the P&L when they’re earned or incurred, not when the cash actually moves. Our Profit and Loss Statement Template and this forecast are meant to be read together for that reason — a profitable month on paper can still be a cash-negative month in the bank.
Do I need to update this every month?
Yes — replace each month’s forecasted numbers with actuals as they come in, and extend the forecast one more month forward so you always have a 12-month runway in view. A forecast that’s six months stale isn’t telling you anything you can act on.
Download the Cash Flow Forecast Template
It’s free, there’s no email signup, and it’s pre-loaded with a sample year of data so you can see exactly how it works before you replace it with your own numbers.
Want new templates emailed to you?
No spam. Unsubscribe anytime. Downloads never require this.
Pair this with our Profit and Loss Statement Template to see both your cash position and your actual profitability side by side. And once you know your cash position, our Break-Even Calculator tells you exactly how much you need to sell each month to stay positive. And if you’re curious what consistent cash flow and profitability translate to in terms of what the business itself is worth, our Small Business Valuation Calculator walks through that next. For the full picture of what the business owns and owes at any given moment, pair it with our Balance Sheet Template.
For a complete linked system where your cash flow forecast connects to a full income statement and balance sheet, see our 3-Statement Financial Model Template.
