
Most small business owners have seen a profit and loss statement. Their bookkeeper sends one every month, their accounting software generates one automatically, and at some point they’ve scrolled to the bottom number and felt either relieved or worried. Far fewer actually read the rest of the page — which is a problem, because the bottom line only tells you whether you made money. It doesn’t tell you why, and it doesn’t tell you what’s about to go wrong if nothing changes. That’s exactly the gap this free profit and loss statement template is built to close.
A profit and loss statement (P&L) is really just revenue minus expenses, broken into enough categories that you can see where the money went instead of just how much is left. Read correctly, it tells you whether your pricing covers your real costs, whether a “good month” was actually profitable or just busy, and whether your expenses are creeping up faster than your sales. The template below builds that structure automatically — you enter your numbers, it calculates gross profit, operating income, and net income (plus every margin in between) for all twelve months and the year as a whole.
What’s Inside the Free Profit and Loss Statement Template
The download is a single Excel file, pre-loaded with a sample year of data from a small product-and-service business so you can see exactly how it behaves before you replace it with your own numbers. This profit and loss statement template is built as a multi-step P&L — the format that separates gross profit from operating income from net income, rather than lumping everything into one subtraction — because that’s the version that actually tells you something useful. Every total, subtotal, and margin percentage is a formula; you only ever type into the shaded cells.
The Anatomy of a Profit and Loss Statement
Every P&L, no matter the software or template behind it, follows the same waterfall. Each line answers a different question about your business.
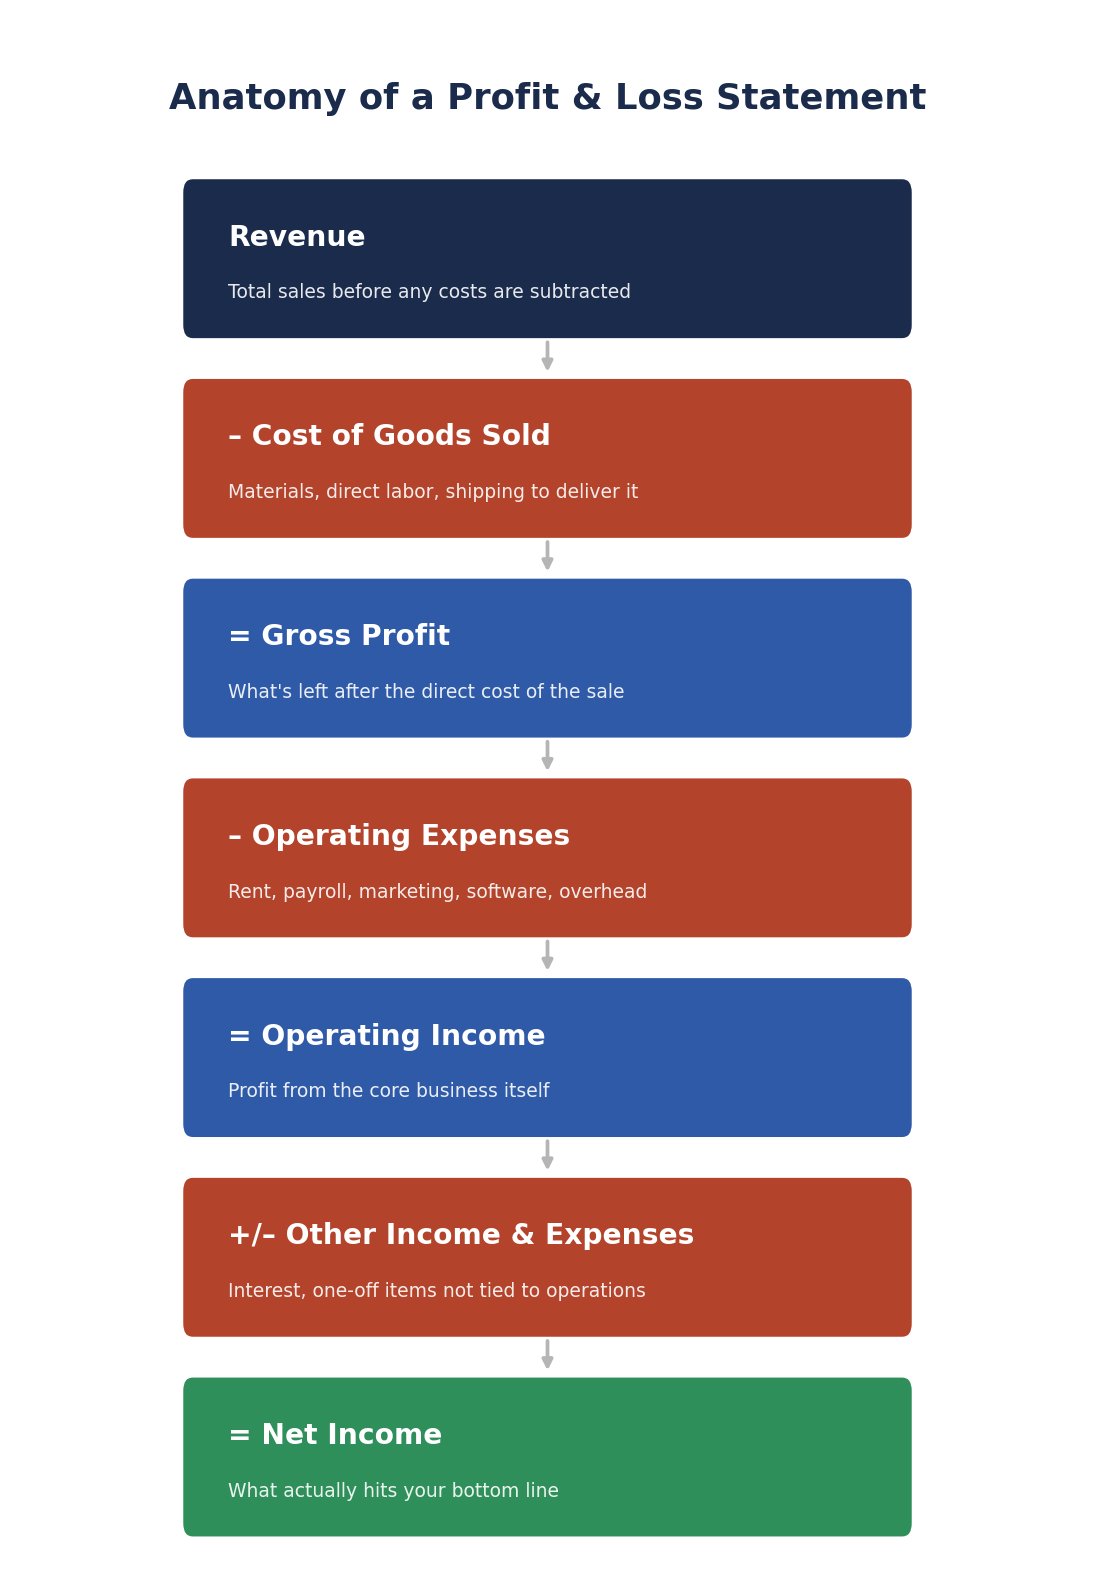
Revenue
Total sales before anything is subtracted, net of returns and discounts. This is the top line — the number that gets the most attention and tells you the least on its own. A business with rising revenue and shrinking profit is not a business that’s winning.
Cost of Goods Sold (COGS)
The costs directly tied to producing what you sold: materials, direct labor, shipping and fulfillment. If a cost would disappear when you stop selling that specific product or service, it belongs here — not in operating expenses. This distinction matters more than most small business owners realize, because it’s the only way to calculate gross margin correctly.
Gross Profit
Revenue minus COGS. This is what’s left to cover everything else in the business — rent, payroll, marketing — before a single dollar counts as profit. Gross margin (gross profit divided by revenue) is one of the most useful numbers on the entire statement, because it tells you whether your pricing structurally works, independent of how much overhead you’re carrying.
Operating Expenses
The costs of running the business that don’t scale directly with each sale: rent, non-production payroll, marketing, software subscriptions, insurance, utilities. These costs are largely fixed in the short term, which is exactly why they need their own section — they behave differently than COGS and respond to different decisions.
Operating Income
Gross profit minus operating expenses. This is profit from the actual business — what it earns before financing costs, taxes, or one-off items get involved. Operating income is the number most worth watching month to month, because it reflects the health of operations without noise from unrelated items.
Other Income and Expenses
Interest paid on a loan, interest earned on a bank balance, a one-time gain or loss — anything not tied to normal operations. Keeping this separate from operating expenses means a single unusual item (a lawsuit settlement, a refinanced loan) doesn’t distort your read on how the core business is actually performing.
Net Income
Operating income plus or minus other income and expenses. This is the true bottom line, and the number your tax return ultimately cares about. Net profit margin (net income divided by revenue) is worth tracking over time even more than the dollar figure — a small business with consistent 5-8% net margins is generally healthier than one bouncing between 15% and -10%, even if the second one has a better average.
Single-Step vs. Multi-Step: Which Format Should You Use
A single-step P&L does one subtraction: total revenue minus total expenses equals net income. It’s faster to build and fine for a very simple sole proprietorship with few expense categories, but it hides the two most useful numbers on the whole statement — gross margin and operating margin — inside one undifferentiated expense total.
A multi-step P&L, the format this template uses, breaks that same math into stages: gross profit, then operating income, then net income. The extra structure costs almost nothing to maintain once the formulas are built, and it’s the only version that lets you answer questions like “is this a pricing problem or an overhead problem?” without redoing the math by hand. Once a business has any meaningful COGS or more than a handful of expense categories, multi-step is worth the small amount of extra setup.
Profit and Loss Statement vs. Income Statement vs. Cash Flow Statement
These get confused constantly, and two of the three are actually the same thing. A profit and loss statement and an income statement are identical — different names for the same report, as Investopedia’s definition confirms, and which one you hear depends on who’s talking, not on any real difference in content.
A cash flow statement is genuinely different. It tracks money actually moving in and out of your bank account, while a P&L tracks revenue and expenses when they’re earned or incurred — which often happens on a different day than the cash does. A large invoice you sent this month counts as revenue on the P&L immediately, but if the client doesn’t pay for 45 days, that revenue and the cash it represents show up in two different months.
This is exactly how a business can show a profit on paper and still run out of money — profitability and cash position are related but separate questions, and this profit and loss statement template only answers one of them. If cash timing is the thing keeping you up at night, our Cash Flow Forecast Template is built specifically for that side of the picture.
Common P&L Mistakes Small Business Owners Make
I do bookkeeping and financial analysis for small business clients on the side, and the P&Ls I get handed to clean up almost never have a math problem — they have a habit problem. The same handful of mistakes show up again and again, whether it’s a solo consultant or a ten-person shop:
A few habits show up often enough that they’re worth naming directly for anyone using this profit and loss statement template, since most P&L guides skip straight past them.
Treating profit and cash as the same thing. As covered above, they’re not, and this single confusion causes more small business cash crises than almost anything else — a business can be genuinely profitable on its P&L and still bounce a payroll check because the cash hasn’t arrived yet.
Mixing personal and business expenses. It’s common in the first year or two, and it quietly wrecks every margin calculation on the statement. If a personal expense runs through the business account, either back it out before calculating anything or, better, stop running it through the business account at all — it makes bookkeeping, taxes, and this entire template less accurate for no real benefit.
Lumping everything into one expense category instead of separating COGS from operating expenses. This is the single most common reason a P&L looks fine on the bottom line but hides a pricing problem — without a real gross margin figure, a business can’t tell whether it’s losing money on each sale or just carrying too much overhead.
Only building a P&L at tax time. A statement that’s twelve months stale can’t catch a problem while it’s still cheap to fix. Monthly is the right cadence for most small businesses — it’s frequent enough to catch a bad trend within a month or two, not so frequent that it becomes a chore.
Watching the net income dollar figure and ignoring the margin percentages. A business that grows revenue 30% while its net margin quietly drops from 8% to 3% is not obviously in trouble by looking at the bottom line alone — the dollar amount can even go up. The margin percentages are what catch that kind of erosion before it becomes serious.
How to Use It Every Month
Using this profit and loss statement template, enter revenue and COGS for the month first — those two rows drive gross profit and gross margin automatically. Add operating expenses next, ideally pulled from your bank and credit card statements rather than estimated, since rough guesses defeat the purpose of tracking this at all. Everything below that — gross profit, operating income, net income, and every margin percentage — recalculates on its own.
Then spend two minutes actually reading it: compare this month’s margins to last month’s, not just the revenue and net income totals. A gross margin that’s drifted down three points over two months is worth investigating while it’s still a small problem, and that comparison is the entire reason a P&L is more useful than a bank balance.
How to Build an Income Statement from This Profit and Loss Statement Template
An income statement is the formal, report-ready version of a profit and loss statement. The numbers are identical. What changes is the presentation: a fixed order of lines, a clear reporting period, and subtotals a lender, investor, or accountant expects to see.
The free profit and loss statement template is already laid out in that order, so turning any month into an income statement takes a few minutes.
The Income Statement Format, Line by Line
A standard income statement runs top to bottom in six steps:
- Revenue: total sales for the period, before any costs.
- Cost of goods sold: the direct costs of delivering what you sold. Revenue minus this line is gross profit.
- Operating expenses: rent, payroll, software, marketing, and other running costs. Gross profit minus this line is operating income.
- Other income and expenses: interest, one-off gains, and losses outside normal operations.
- Taxes: income tax for the period, estimated if the final figure is not known yet.
- Net income: what is left after everything above. This is the bottom line.
A Simple Income Statement Example
Say a small design studio earns $40,000 in a month. Direct costs (contractors and software licenses) are $12,000, which leaves a gross profit of $28,000. Operating expenses come to $19,000, so operating income is $9,000.
After $500 of loan interest and $1,700 of estimated tax, net income is $6,800. That is a 17% net margin. Enter those figures into the template and every subtotal and margin percentage calculates for you.
When You Need a Formal Income Statement
Most owners can run on a simple monthly P&L. You will want the formal version when you apply for a loan, raise money, prepare for a tax filing, or hand the books to an accountant. Lenders usually ask for 12 months plus a year-to-date column, which is exactly what the 12-month template produces.
An income statement only tells you about profit, not cash. To see how your profit connects to your bank balance, read it next to your balance sheet and your cash flow forecast. Net income also feeds directly into your statement of retained earnings.
If you want to compare each month against a plan, pair the template with our budget vs. actual analysis. Together they show not just what you earned, but whether you earned what you expected.
Tips for Getting More From the Profit and Loss Statement Template
Keep one file per year and save a fresh copy of the profit and loss statement template each January. That gives you clean year-over-year comparisons without overwriting last year’s figures.
Close each month by the tenth of the following month. A profit and loss statement template is only useful if the numbers are recent enough to act on.
Use the same expense categories every month. Renaming lines mid-year breaks your trends, so decide on your categories once and stick with them for the whole year.
Finally, note anything unusual in a comment next to the cell, such as a one-time equipment purchase or a seasonal spike. Six months later, those notes explain the numbers faster than any formula can.
Frequently Asked Questions
What’s a good net profit margin for a small business?
There’s no single right answer since it varies heavily by industry, but a commonly cited range for small businesses overall is roughly 7-10% net margin, with plenty of healthy businesses running lower and high-margin service or software businesses running well above it. The more useful benchmark is usually your own history — a stable or improving margin over time matters more than hitting a specific industry number.
Is a profit and loss statement the same as an income statement?
Yes. They’re the same report under two different names. Some software and some accountants default to one term over the other, but there’s no structural difference between them.
How often should I create a P&L?
Monthly, for most small businesses. It’s frequent enough to catch a problem — a margin drifting down, an expense creeping up — while it’s still small and cheap to fix, without being so frequent that it turns into unnecessary overhead.
Can I build a P&L without accounting software?
Yes, and this template is built for exactly that. If you’re already using QuickBooks, Xero, or similar software, it will generate a P&L for you automatically and this template works just as well as a way to double-check those numbers or model a scenario the software doesn’t easily show.
My P&L shows a profit, but there’s no cash in the bank. What’s going on?
This is normal and usually comes down to timing, not an error. Revenue counts on the P&L when it’s earned, not when the cash actually arrives — an unpaid invoice, a big loan payment that isn’t an “expense” in the P&L sense, or inventory you paid for in cash but haven’t sold yet can all create a real gap between paper profit and bank balance. Pair this template with our Cash Flow Forecast Template to see both sides at once.
Download the Free Profit and Loss Statement Template
Download the free Profit and Loss Statement Template below — no email signup required. It’s pre-loaded with a full year of sample data from a small business so you can see exactly how the formulas work before you clear it out and enter your own numbers.
Want new templates emailed to you?
No spam. Unsubscribe anytime. Downloads never require this.
Looking for more small business finance tools? Check out our Cash Flow Forecast Template, our Break-Even Calculator, Contribution Margin Calculator, our Financial Modeling Guide, the Small Business KPI Dashboard, and our Small Business Valuation Calculator. And to see everything the business owns and owes at a glance, check out our Balance Sheet Template.
Want your P&L linked to a full balance sheet and cash flow forecast instead of standing alone? Check out our 3-Statement Financial Model Template.
